|

Tesla shaking hands with notable higher timeframe resistance

Resistance putting in an appearance on the monthly timeframe

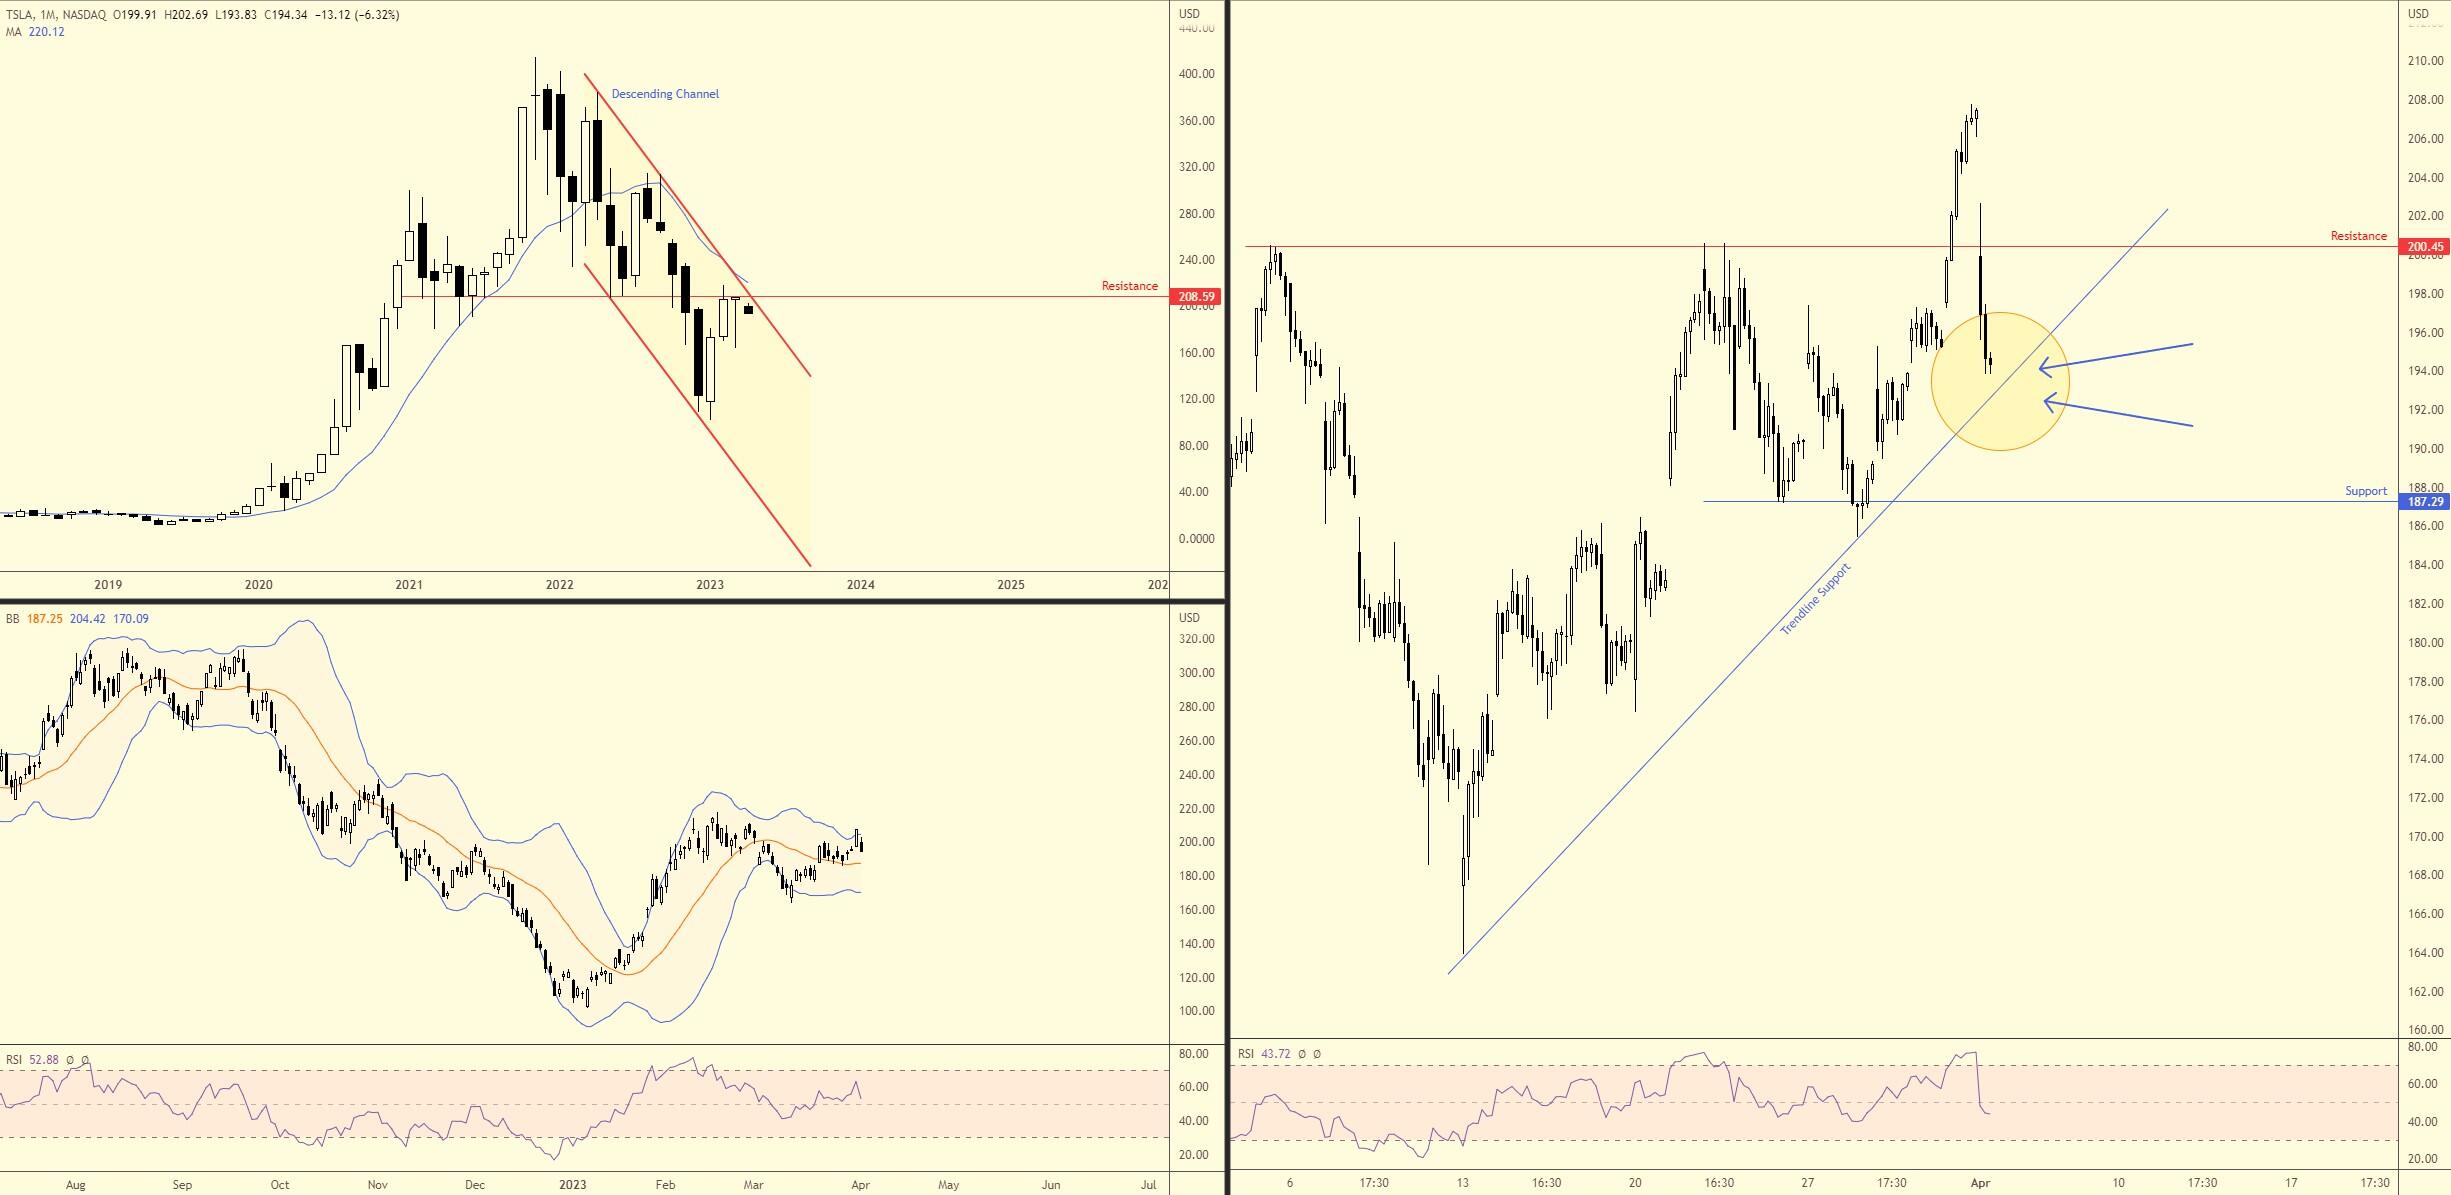
As seen from the monthly timeframe, price action is crossing swords with key resistance at $208.59. We can also see that the unit is testing space just south of channel resistance, taken from the high of $384.29, and the 12- month simple moving average, currently fluctuating around $220.15. Combined, this represents a notable technical ceiling to be mindful of.

Daily chart testing upper bollinger band

Price movement out of the daily timeframe witnessed a close outside of the upper Bollinger Band on Friday (set to 2 standard deviations [calculated through the 20-period simple moving average]). Tesla is trading 6.0% lower at the time of writing after gapping south at the open (note that the company fell a whopping 65.0% last year, erasing the prior year’s upside and about half of 2020’s gains) and appears poised to at least revert back to the Bollinger Band’s mean value of around $187.26.

The Relative Strength Index (RSI) is also on the doorstep of its 50.00 centreline; a move under the aforementioned line would indicate negative momentum (average losses exceeding average gains) and perhaps prompt a (price) drop under the Bollinger Band’s 20-period SMA.

All eyes on H1 trendline support

Having noted the monthly and daily timeframes testing resistance, the H1 trendline support drawn from the low $163.92 will likely be watched. Defending the ascending line is likely to be short-lived, with a break to the downside favoured, targeting support coming in from $187.29.

Adding to the bearish vibe and potential breakout below H1 trendline support, the H1 RSI recently voyaged south of its 50.00 centreline.

TSLA

Author

Aaron Hill

Aaron Hill

FP Markets

After completing his Bachelor’s degree in English and Creative Writing in the UK, and subsequently spending a handful of years teaching English as a foreign language teacher around Asia, Aaron was introduced to financial trading,

More from Aaron Hill
Share:

Editor's Picks

EUR/USD weakens to near 1.1900 as traders eye US data

EUR/USD eases to near 1.1900 in Tuesday's European trading hours, snapping the two-day winning streak. Markets turn cautious, lifting the haven demand for the US Dollar ahead of the release of key US economic data, including Retail Sales and ADP Employment Change 4-week average.

GBP/USD stays in the red below 1.3700 on renewed USD demand

GBP/USD trades on a weaker note below 1.3700 in the European session on Tuesday. The pair faces challenges due to renewed US Dollar demand, UK political risks and rising expectations of a March Bank of England rate cut. The immediate focus is now on the US Retail Sales data. 

Gold sticks to modest losses above $5,000 ahead of US data

Gold sticks to modest intraday losses through the first half of the European session, though it holds comfortably above the $5,000 psychological mark and the daily swing low. The outcome of Japan's snap election on Sunday removes political uncertainty, which along with signs of easing tensions in the Middle East, remains supportive of the upbeat market mood. This turns out to be a key factor exerting downward pressure on the safe-haven precious metal.

Bitcoin Cash trades lower, risks dead-cat bounce amid bearish signals

Bitcoin Cash trades in the red below $522 at the time of writing on Tuesday, after multiple rejections at key resistance. BCH’s derivatives and on-chain indicators point to growing bearish sentiment and raise the risk of a dead-cat bounce toward lower support levels.

Dollar drops and stocks rally: The week of reckoning for US economic data

Following a sizeable move lower in US technology Stocks last week, we have witnessed a meaningful recovery unfold. The USD Index is in a concerning position; the monthly price continues to hold the south channel support.

Bitcoin Cash trades lower, risks dead-cat bounce amid bearish signals

Bitcoin Cash (BCH) trades in the red below $522 at the time of writing on Tuesday, after multiple rejections at key resistance. BCH’s derivatives and on-chain indicators point to growing bearish sentiment and raise the risk of a dead-cat bounce toward lower support levels.