|

SuperMicro Computers Inc. (SMCI) Elliott Wave technical analysis [Video]

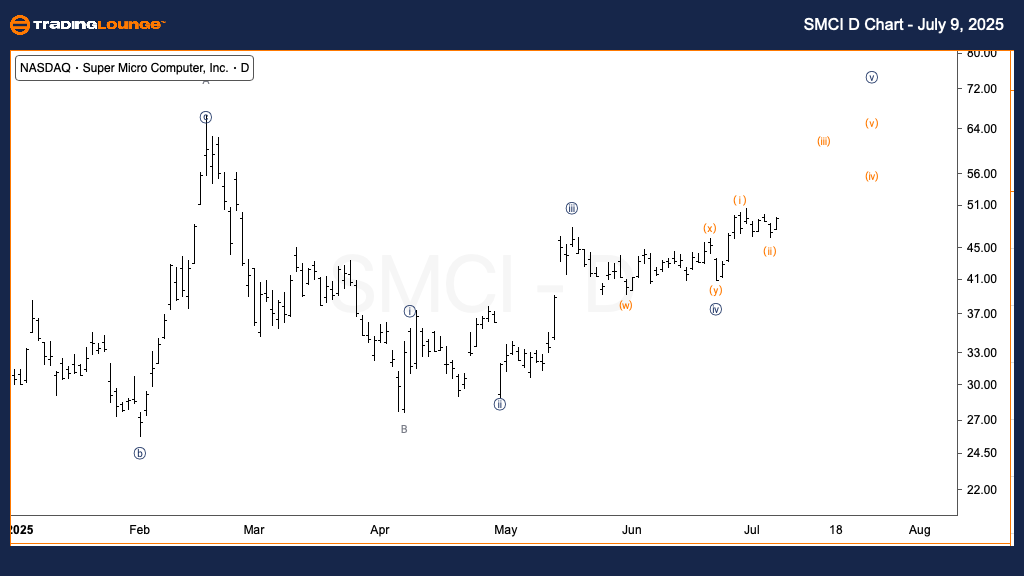
SMCI Elliott Wave technical analysis – Daily chart

Function: Counter trend.

Mode: Corrective.

Structure: Flat.

Position: Wave {v} of C.

Direction: Upward toward wave {v}.

Details: A major pullback has been ongoing since early this year. The current move suggests an upward push to finalize the correction.

On the daily chart, SuperMicro Computers Inc. (SMCI) is in the last stage of a corrective flat pattern that began at the start of 2025. The stock is currently advancing through wave {v} of C, indicating that the countertrend structure is nearly complete. This upward move is expected to form the final leg in the ongoing correction before the larger trend resumes.

Chart

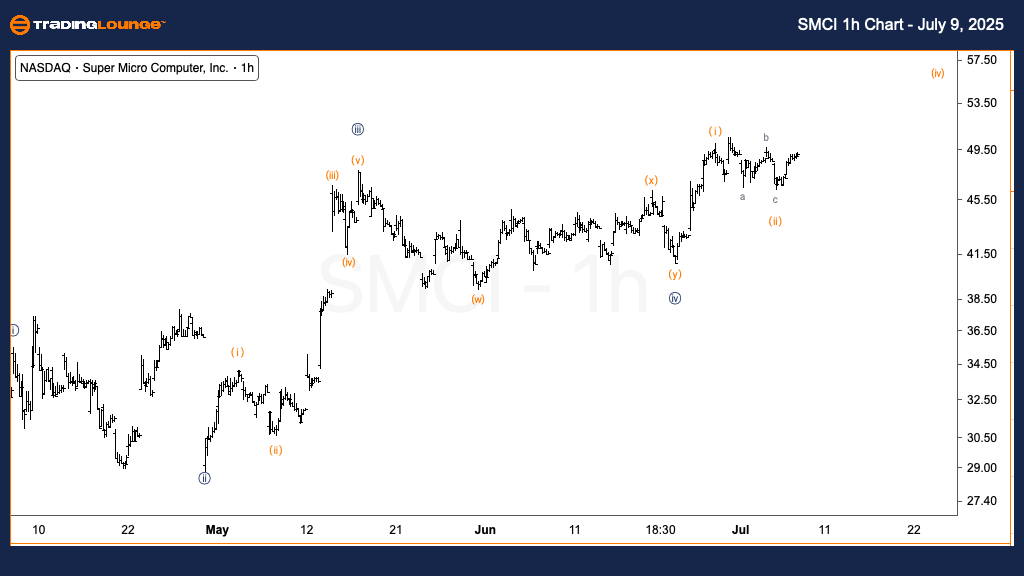
SMCI Elliott Wave technical analysis – One-hour chart

Function: Counter trend.

Mode: Corrective.

Structure: Flat.

Position: Wave (ii) of {v}.

Direction: Upside into wave (iii).

Details: Wave (ii) seems to have completed. Price is nearing the $50 mark, a key level to confirm further upside potential.

In the 1-hour view, SMCI appears to have bottomed in wave (ii) of {v} and is now progressing into wave (iii). The price is closing in on the $50 level, a key area where prior support may be retested. If the price sustains above this zone, it would strengthen the bullish outlook and confirm the continuation of wave (iii), leading to the completion of wave C.

Chart

SuperMicro Computers Inc. (SMCI) Elliott Wave technical analysis [Video]

Author

Peter Mathers

Peter Mathers

TradingLounge

Peter Mathers started actively trading in 1982. He began his career at Hoei and Shoin, a Japanese futures trading company.

More from Peter Mathers
Share:

Markets move fast. We move first.

Orange Juice Newsletter brings you expert driven insights - not headlines. Every day on your inbox.

By subscribing you agree to our Terms and conditions.

Editor's Picks

EUR/USD eases from around 1.1800 after US GDP figures

The US Dollar is finding some near-term demand after the release of the US Q3 GDP. According to the report, the economy expanded at an annualized rate of 4.3% in the three months to September, well above the 3.3% forecast by market analysts.

GBP/USD retreats below 1.3500 on modest USD recovery

GBP/USD retreats from session highs and trades slightly below 1.3500 in the second half of the day on Tuesday. The US Dollar stages a rebound following the better-than-expected Q3 growth data, limiting the pair's upside ahead of the Christmas break.

Gold: Record rally sustains above $4,500 on safe-haven flows

Gold sustains the record-setting rally above $4,500 in the Asian session on Wednesday. The Israel-Iran conflict and the escalating US-Venezuela tensions boost safe-haven flows into Gold. Furthermore, US Q3 GDP data fails to lift the US Dollar amid growing bets for two Fed rate cuts in 2026, underpinning the non-yielding bullion. 

The crypto market is preparing us for a deeper global sell-off

The crypto market capitalisation fell by 1.4% to $2.97T, falling below the $3T mark once again. The market was unable to repeat the robust rebound from the local bottom, as it did after 23 November and 2 December, indicating increased pressure from sellers.

Ten questions that matter going into 2026

2026 may be less about a neat “base case” and more about a regime shift—the market can reprice what matters most (growth, inflation, fiscal, geopolitics, concentration). The biggest trap is false comfort: the same trades can look defensive… right up until they become crowded.

Dogecoin ticks lower as low Open Interest, funding rate weigh on buyers

Dogecoin extends its decline as risk-off sentiment dominates across the crypto market. DOGE’s derivatives market remains weak amid suppressed futures Open Interest and perpetual funding rate.