Stocks: The correction has arrived – What lies ahead?

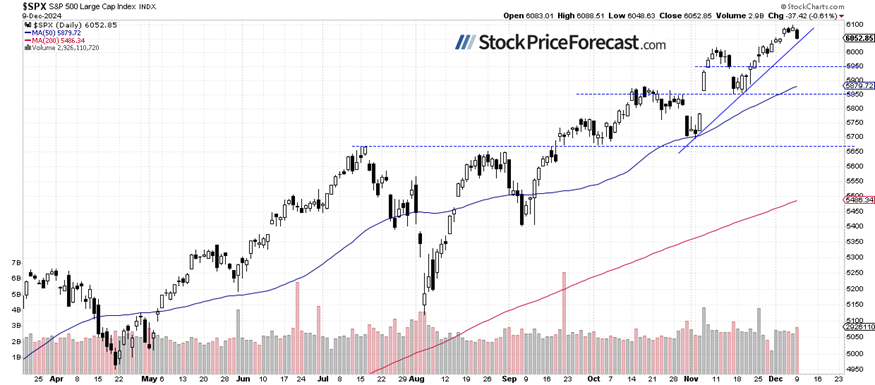
Stock prices pulled back on Monday, with the S&P 500 index closing 0.61% lower following profit-taking after Friday’s employment data. The market retraced some of its recent gains, closing the daily gap from last Wednesday. This morning, the S&P 500 index is expected to open 0.1% higher, and it may see some sideways trading ahead of the important Consumer Price Index release tomorrow.
Yesterday, I noted that “the S&P 500 index reached a new record high of 6,099.97 on Friday. The key question remains whether the uptrend will continue, despite signs of short-term overbought conditions.” Monday’s pullback appears to be a short-term correction or perhaps the beginning of a consolidation phase.
Investor sentiment has improved significantly. as shown in last Wednesday’s AAII Investor Sentiment Survey, which reported that 48.3% of individual investors are bullish, while 30.7% of them are bearish - a decrease from 38.6% the previous week.
The S&P 500 pulled back from the 6,100 level, as we can see on the daily chart.
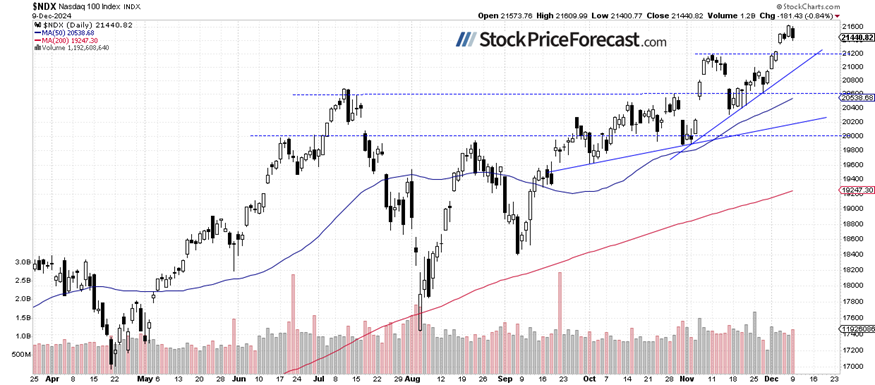
Nasdaq 100: Sideways trading
On Friday, the Nasdaq 100 extended its rally, reaching a new record high of 21,626.31. However, it closed 0.84% lower yesterday. For now, it looks like a consolidation and a relatively flat correction within the ongoing uptrend.
There are no immediate negative signals, but short-term overbought conditions could lead to a correction.
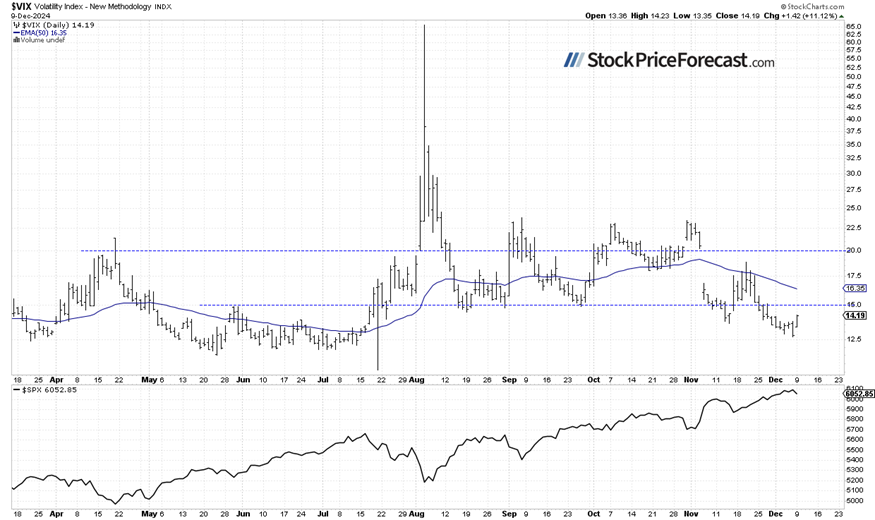
VIX rebounded above 14
The VIX index, a measure of market volatility, dropped to a new local low of 12.70 on Friday, its lowest since early July. Yesterday, the pullback in stock prices pushed the VIX higher, closing above 14. Despite this increase, volatility remains relatively low.
Historically, a dropping VIX indicates less fear in the market, and rising VIX accompanies stock market downturns. However, the lower the VIX, the higher the probability of the market’s downward reversal. Conversely, the higher the VIX, the higher the probability of the market’s upward reversal.
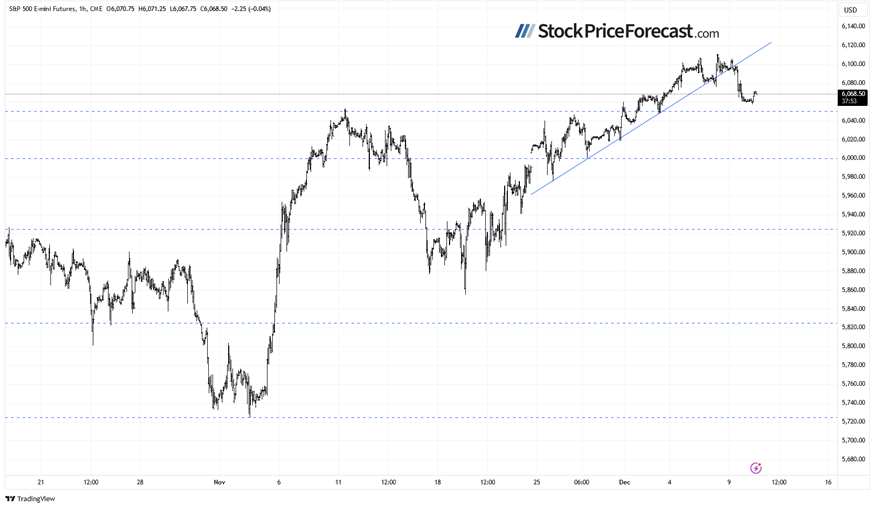
S&P 500 futures broke trend line
The S&P 500 futures contract dipped to a local low of around 6,058. Resistance remains in the 6,100–6,110 range, with support at 6,050, the previous high. This morning, the market is rebounding slightly, retracing some of the Monday’s decline. For now, it appears to be an upward correction.
Conclusion
Today’s trading session is likely to open slightly higher for the S&P 500 index, which may enter a consolidation phase following its recent record-breaking rally. Investors are awaiting tomorrow’s key consumer inflation data.
Last Monday, in my Stock Price Forecast for December 2024, I wrote “the stock market experienced a strong rally in November, driven by the presidential election outcome. While December is historically a bullish month, increased volatility and a short-term correction remain likely”
For now, my short-term outlook is neutral.
Here’s the breakdown:
-
The S&P 500 pulled back from Friday’s record high.
-
The market is still seeing increased volatility following the post-election rally.
-
In my opinion, the short-term outlook is neutral.
Want free follow-ups to the above article and details not available to 99%+ investors? Sign up to our free newsletter today!
Want free follow-ups to the above article and details not available to 99%+ investors? Sign up to our free newsletter today!
Author

Paul Rejczak
Sunshine Profits
Paul Rejczak is a stock market strategist who has been known for the quality of his technical and fundamental analysis since the late nineties.


