Stocks rebound from new lows: Is the correction over?
Stocks opened lower on Monday, extending their short-term downtrend and reaching new local lows. However, the market rebounded, and the S&P 500 index managed to close 0.16% higher. The index advanced from its daily low of 5,773.31 - the lowest since November 6.
Today, the S&P 500 index is expected to open 0.6% higher following the release of the Producer Price Index (PPI), which came in lower than expected at +0.2% month-over-month.
On December 9, I noted that “the S&P 500 index reached a new record high of 6,099.97 on Friday. The key question remains whether the uptrend will continue, despite signs of short-term overbought conditions.” The sharp decline following the Fed’s release confirmed that the market was forming a topping pattern, as fluctuations led to a break lower.
Investor sentiment has slightly worsened again, as shown by last Wednesday’s AAII Investor Sentiment Survey, which reported that 34.7% of individual investors are bullish, while 37.4% of them are bearish.
The S&P 500 index rebounded from its November 6 (post-election day) daily gap up, as we can see on the daily chart.

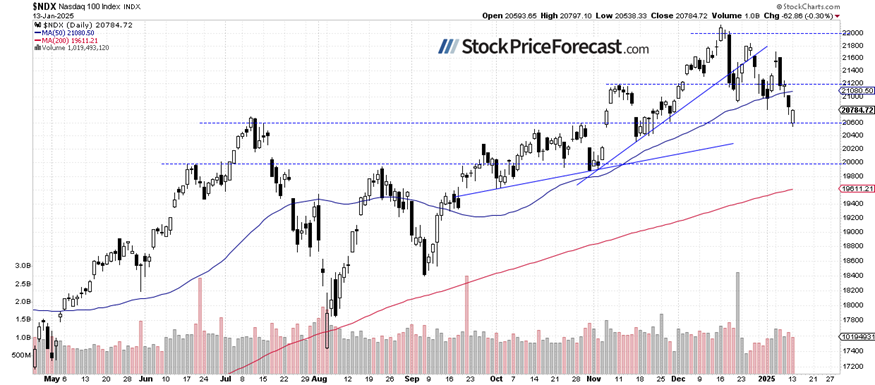
Nasdaq 100 remains below 21,000
The Nasdaq 100 declined 0.30% yesterday after rebounding from its daily low of 20,538.33. Key support remains around 20,600, marked by July’s high. This morning, the index is set to open 0.7% higher, retracing some of its recent declines.
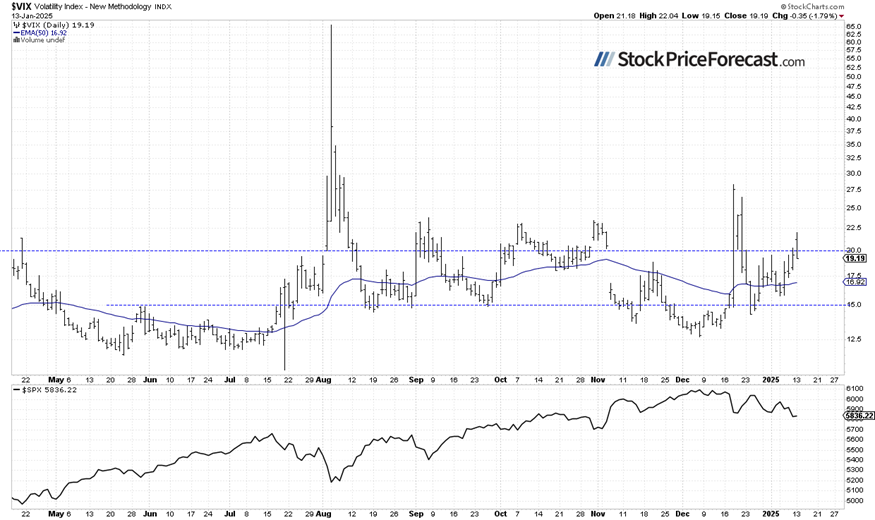
VIX: New local high and pullback
On December 18, the VIX index, a measure of market volatility, surged to 28.32, its highest level since early August. After dropping below 15 in late December, the VIX rose again, and yesterday, it reached a high of 22.04. However, advancing stock prices pushed the VIX back below the 20 level.
Historically, a dropping VIX indicates less fear in the market, and rising VIX accompanies stock market downturns. However, the lower the VIX, the higher the probability of the market’s downward reversal. Conversely, the higher the VIX, the higher the probability of the market’s upward reversal.
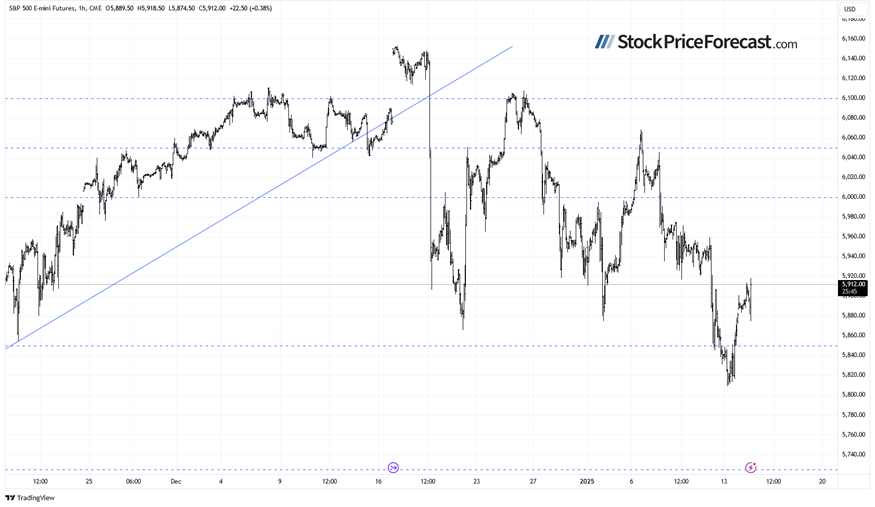
S&P 500 futures contract: Higher following PPI
This morning, the S&P 500 futures contract is fluctuating near the 5,900 level. The market moved slightly lower following yesterday’s intraday rebound, and the PPI triggered a rebound. As mentioned yesterday, “Key support remains at 5,800, with resistance at 5,880–5,900, marked by the recent support area.”
Conclusion
The PPI data is likely to push stock prices higher this morning, extending the S&P 500’s rebound from yesterday’s new low, which fell below the 5,800 level. The market rebounded from its election day daily gap-up, and that area remains a key support level.
The S&P 500 faces more uncertainty ahead of the upcoming quarterly earnings season, economic data, and Donald Trump’s inauguration on January 20.
Last Monday, in my Stock Price Forecast for January 2025, I wrote that “the stock market is poised for continued fluctuations following the post-election rally in November. Although the S&P 500 dipped by 2.5% last month, this appears to be just a correction of November’s gains.
Will the market resume its uptrend and reach new record highs? This appears likely at some point, driven by growing optimism ahead of Trump’s upcoming inauguration on January 20. However, rallies may provide selling opportunities, leading to a medium-term consolidation phase.”
For now, my short-term outlook is neutral.
Here’s the breakdown:
-
The S&P 500 is likely to extend yesterday’s rebound this morning.
-
The stock market is still seeing increased volatility following the post-election rally.
-
In my opinion, the short-term outlook is neutral.
Want free follow-ups to the above article and details not available to 99%+ investors? Sign up to our free newsletter today!
Want free follow-ups to the above article and details not available to 99%+ investors? Sign up to our free newsletter today!
Author

Paul Rejczak
Sunshine Profits
Paul Rejczak is a stock market strategist who has been known for the quality of his technical and fundamental analysis since the late nineties.


