Stocks expected to rebound, but is the correction over?

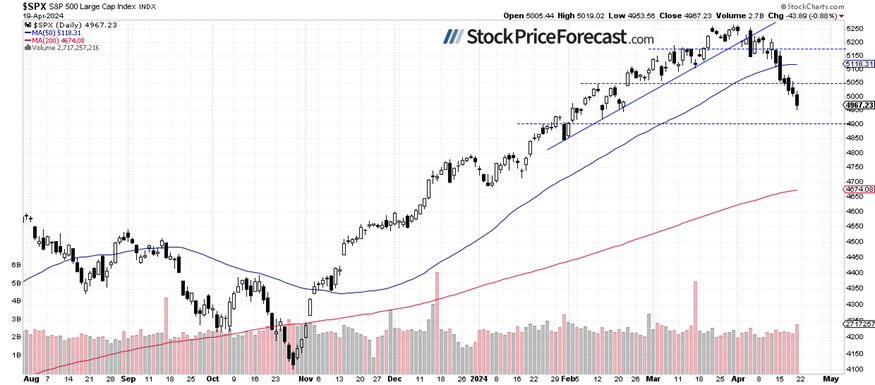
Stock prices sold off on Friday on Middle East tensions as markets feared potential retaliation from Israel following Iran’s attack. The S&P 500 index dropped by 0.88%, falling below 5,000 and reaching a new medium-term low of 4,953.56. This marked its lowest level since late February, with a decline of over 311 points or 5.9% from the record high of 5,264.85 on February 28. The market extended its short-term downtrend; however, it still looks like a correction following a medium-term uptrend from November.
Today, sentiment has improved, with the futures contract gaining 0.6% ahead of the cash market open. The S&P 500 index is expected to approach the 5,000 level again, although there may be some lingering uncertainty as investors await key economic data and a series of quarterly earnings releases this week. Tomorrow, we will get releases from TSLA and V, on Wednesday from META, and on Thursday from GOOG, INTC, MSFT, among others.
In my Stock Price Forecast for April, I noted, “Closing the month of March with a gain of 3.1%, the question arises: Will the S&P 500 further extend the bull market in April, or is a downward correction on the horizon? From a contrarian standpoint, such a correction seems likely, but the overall trend remains bullish.”
The investor sentiment has worsened recently, as indicated by the last Wednesday’s AAII Investor Sentiment Survey, which showed that 38.3% of individual investors are bullish, while 34.0% of them are bearish, a big increase from the previous week's 24%. The AAII sentiment is a contrary indicator in the sense that highly bullish readings may suggest excessive complacency and a lack of fear in the market. Conversely, bearish readings are favorable for market upturns.
On Friday, the market broke a significant support level, marked by the daily gap up from February 22 (4,983.21-5,038.83). The index has formed the sixth consecutive black candle on the chart, which means that for the sixth time the session's closing was lower than its opening. It reached a consolidation from mid-February, as we can see on the daily chart.
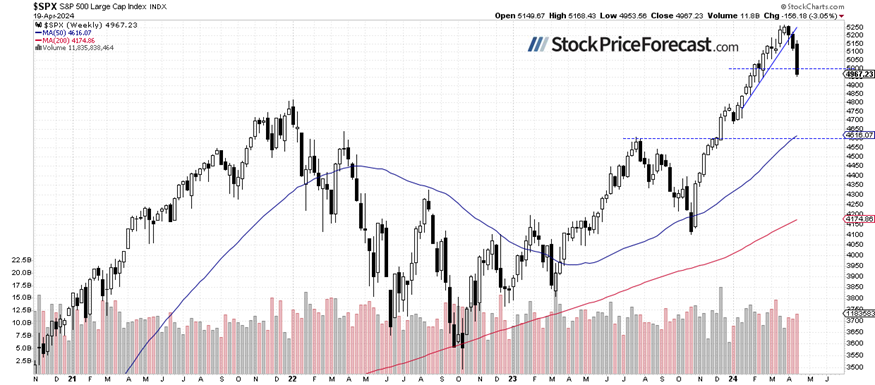
S&P 500 – Weekly sell-off of over 3%
Compared to the previous Friday’s closing price, the index lost 3.05%, and in the previous week it lost 1.6%. On previous Friday, I wrote that “Short-term consolidation near the new records may suggest that the market is potentially topping out, though no clearly negative signals are evident yet.” Indeed, the market topped out, breaking below its upward trend line, and accelerated a short-term downtrend.
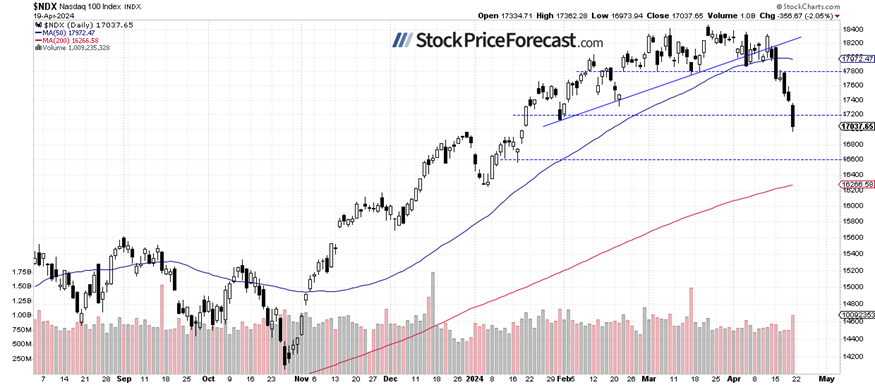
Nasdaq 100 sold off to 17,000
Recently, the technology-focused Nasdaq 100 index broke the 18,000 level, and on Friday, it briefly dipped below the 17,000 level, reaching a local low of 16,973.94.
The Nasdaq 100 is expected to open 0.7% higher this morning, pausing from last week’s declines. Investors will be eagerly awaiting the mentioned earnings releases from key big tech companies.
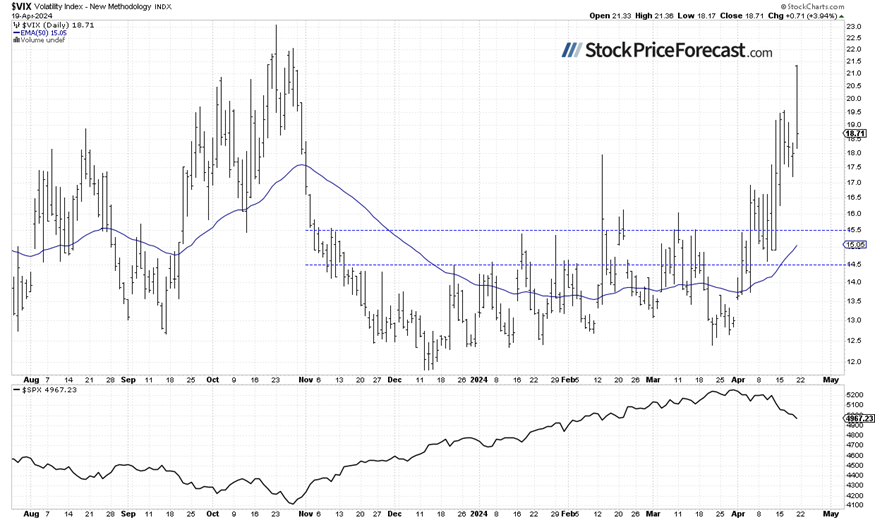
VIX backed off from new high
The VIX index, also known as the fear gauge, is derived from option prices. In late March, it was trading around the 13 level. However, recent market volatility has led to an increase in the VIX. On Friday, it reached a high of 21.4, the highest since late October, indicating fear in the market. However, before the close of the day, it dropped back below the 19 level, hinting at a potential rebound this week.
Historically, a dropping VIX indicates less fear in the market, and rising VIX accompanies stock market downturns. However, the lower the VIX, the higher the probability of the market’s downward reversal.
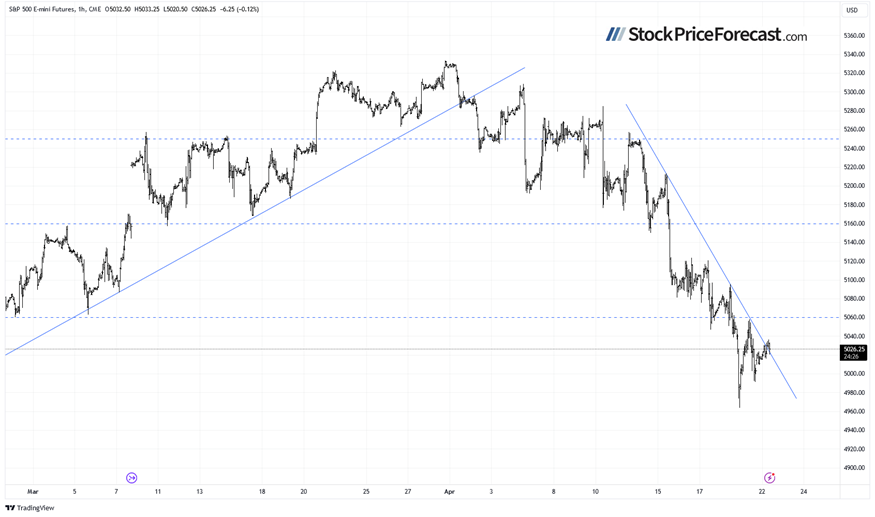
Futures contract holding 5,000
Let’s take a look at the hourly chart of the S&P 500 futures contract. It rebounded from Friday’s low of around 4,964, and this morning, it’s trading above 5,000. However, it's still following a short-term downward trend line. The resistance level is at 5,080-5,100, among others.
The market has been in a slight downtrend since the start of the month, and last Monday, it accelerated the move lower.
Conclusion
The S&P 500 index accelerated its downtrend last week, extending a correction from the March 28 record high of 5,264.85 on Middle East tensions, strong U.S. dollar. On Friday, it sold off below the important 5,000 level, and this morning, it is poised to open higher, yet still below that level.
Is this a short-term bottoming pattern? It’s hard to say. It is still a short-term downtrend. Therefore, it's prudent to maintain a defensive approach and refrain from attempting to buy the dips.
On April 2, I wrote that “In April, we will see a usual series of important economic data, but with the Fed leaning towards easing monetary policy, we should perhaps pay more attention to the quarterly earnings season. However, good earnings may be met with a profit-taking action this time. The market appears to be getting closer to a correction.”
Then, I added: “It appears that profit-taking is happening. Is this a new downtrend? Likely not, however, a correction towards 5,000-5,100 is possible at some point.”
For now, my short-term outlook remains neutral.
Here’s the breakdown:
-
The S&P 500 is likely to retrace some of its Friday’s decline, potentially as an upward correction
-
Stock prices are the lowest since February, indicating a correction of the medium-term advance.
-
In my opinion, the short-term outlook is neutral.
The full version of today’s analysis - today’s Stock Trading Alert - is bigger than what you read above, and it includes the additional analysis of the Apple (AAPL) stock and the current S&P 500 futures contract position. I encourage you to subscribe and read the details today. Stocks Trading Alerts are also a part of our Diamond Package that includes Gold Trading Alerts and Oil Trading Alerts.
Want free follow-ups to the above article and details not available to 99%+ investors? Sign up to our free newsletter today!
Want free follow-ups to the above article and details not available to 99%+ investors? Sign up to our free newsletter today!
Author

Paul Rejczak
Sunshine Profits
Paul Rejczak is a stock market strategist who has been known for the quality of his technical and fundamental analysis since the late nineties.


