Stocks: Another record high, yet correction may be coming

Trading position (short-term, my opinion; S&P 500 futures contract): In my opinion, the short-term outlook is neutral, and no positions are currently justified from the risk/reward point of view.
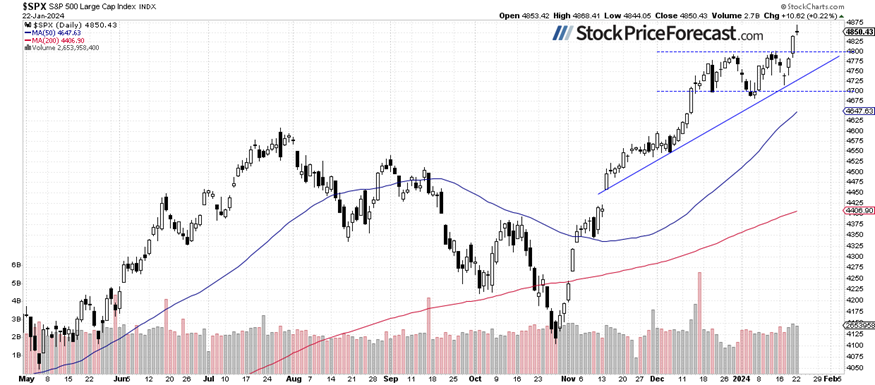
Stocks extended their uptrend on Monday, with the S&P 500 index gaining 0.22%, as investor sentiment remained very bullish ahead of the upcoming quarterly earnings releases and the expected monetary policy easing by the Fed this year. However, the market backed off from the new all-time high of 4,868.41 yesterday, raising a question: Is there any gas left?
On Friday, stock prices broke above their month-long trading range, invalidating any potential medium-term topping pattern scenarios. Yesterday, I wrote that “in the short term, one would expect some downward correction as the market becomes increasingly overbought”. Despite yesterday’s new high, it seems that a correction scenario is likely in the near term. The market rallied from its Wednesday’s daily low of around 4,715 – an advance of over 150 points. Of course, it's hard to tell if this marks the peak of a rally, but caution may be advised, as a correction or consolidation could occur at some point.
Surprisingly, investor sentiment has slightly worsened last week; Wednesday’s AAII Investor Sentiment Survey showed that 40.4% of individual investors are bullish, significantly lower than the week ago. The AAII sentiment is a contrary indicator in the sense that highly bullish readings may suggest excessive complacency and a lack of fear in the market. Conversely, bearish readings are favorable for market upturns.
The S&P 500 futures contract is trading 0.1% higher, indicating a relatively flat opening of the S&P 500 index today. Investors will wait for the important earnings reports. After today's session closes, the market will receive an important report from NFLX, followed by a highly anticipated release from TSLA tomorrow. This morning, reports from GE, JNJ, PG, and VZ, among others, were generally better than expected, and that contributed to a market rebound from overnight lows.
There is some uncertainty following yesterday’s rally – the index pulled back from a new record high, as we can see on the daily chart.
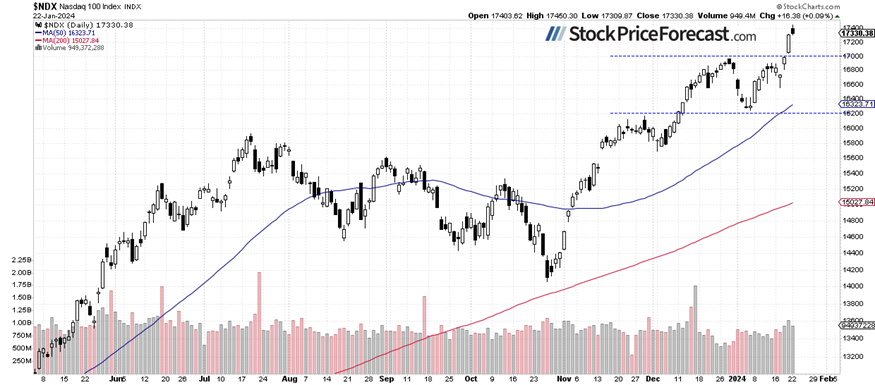
Nasdaq backing off from new high
Yesterday, the technology-focused Nasdaq 100 index reached a new all-time high at the level of 17,450.30 before closing just 0.09% higher. This morning it is expected to open virtually flat, mirroring the broad stock market.
In early January, it bounced sharply, followed by another advance and closing above the important daily gap down of 16,687-16,758, which was a positive signal. Consequently, it broke to new record highs last week. However, a correction may occur at some point as the market is currently technically overbought in the short term.
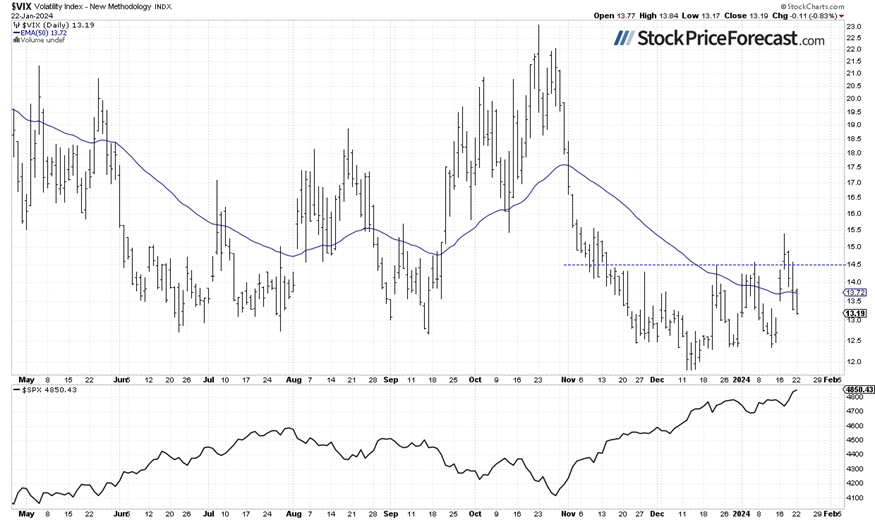
VIX – Another daily drop
The VIX index, also known as the fear gauge, is derived from option prices. On Thursday, it came back below the 14.50 level, marked by the previous local highs, and yesterday, it continued its decline in response to advancing stock prices.
Historically, a dropping VIX indicates less fear in the market, and rising VIX accompanies stock market downturns. However, the lower the VIX, the higher the probability of the market’s downward reversal.
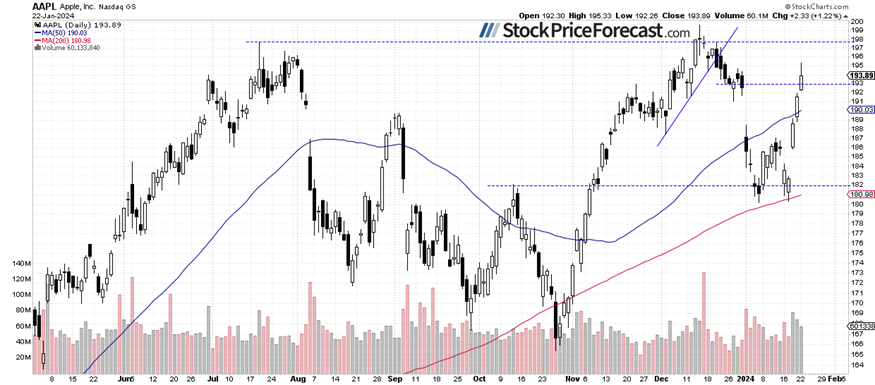
Apple – New high, but more uncertainty
Let’s move on to an individual stock – Apple, which is one of the most important market movers. In early January, it experienced a sharp sell-off. The decline has been significant, suggesting a change in trend. On January 8, I wrote that “(…) the stock approached a potential support level of around $180.” and “The market may see a rebound here.”. This prediction proved accurate, and last week, Apple broke above the resistance level of $188-190. Yesterday, the market neared a potential resistance level of $195-200, where it is likely to consolidate as investors await the quarterly earnings release on February 1.
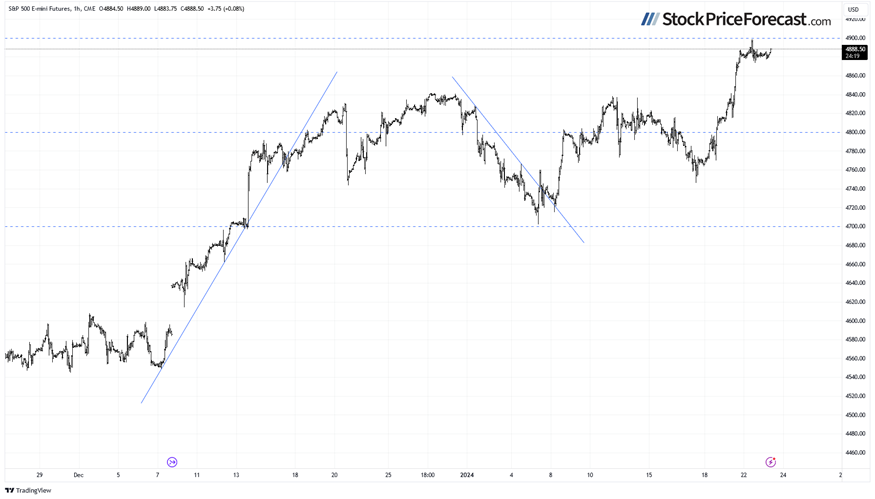
Futures contract trading sideways
Let’s take a look at the hourly chart of the S&P 500 futures contract. This morning, it is fluctuating following the recent rally. There have been no confirmed negative signals so far; however, the market became increasingly overbought in the short-term. The support level remains at 4,840, marked by the recent local highs.
Conclusion
Stock prices are expected to open virtually flat this morning. Investor sentiment remains elevated ahead of upcoming quarterly corporate earnings releases, but the market may see a correction or consolidation following the recent record-breaking rally.
On December 21, I mentioned that “in a short-term the market may see some more uncertainty and volatility”, and indeed, there was a lot of uncertainty following the early-December rally and the breakout of the S&P 500 above the 4,700 level. However, last Friday’s price action left no illusions of a potential medium-term trend reversal. The market is overbought in the short term, but predicting a correction is currently very challenging.
For now, my short-term outlook remains neutral.
I think that no positions are justified from the risk/reward point of view.
Here’s the breakdown:
-
The S&P 500 reached yet another new record high yesterday.
-
Breakout above the recent highs marked a positive signal; however, it’s uncertain whether the market won’t retrace some of the rally. The index may have reached the peak of a short-term uptrend.
-
In my opinion, the short-term outlook is neutral, and no positions are justified from the risk/reward point of view.
As always, we’ll keep you, our subscribers, well-informed.
The full version of today’s analysis - today’s Stock Trading Alert - is bigger than what you read above, and it includes the additional analysis of the Apple (AAPL) stock and the current S&P 500 futures contract position. I encourage you to subscribe and read the details today. Stocks Trading Alerts are also a part of our Diamond Package that includes Gold Trading Alerts and Oil Trading Alerts.
Want free follow-ups to the above article and details not available to 99%+ investors? Sign up to our free newsletter today!
Want free follow-ups to the above article and details not available to 99%+ investors? Sign up to our free newsletter today!
Author

Paul Rejczak
Gold Price Forecast
Paul Rejczak is a stock market strategist who has been known for the quality of his technical and fundamental analysis since the late nineties.















