|

Stock market bottom? Here’s what this seasonality chart says [Video]

Based on this seasonality chart of the U.S. midterm elections for the past 72 years, the stock market could be already entering into the bottoming process. Seasonality or cyclical charts are often used in analogue comparison in the Wyckoff trading method although history doesn’t repeat itself, but it often rhymes.

It is really uncanny to see how S&P 500 moved as per this seasonality chart in the first half of 2022. Click and watch the video below on YouTube (Pro Tip: adjust the speed to 1.5–2X).

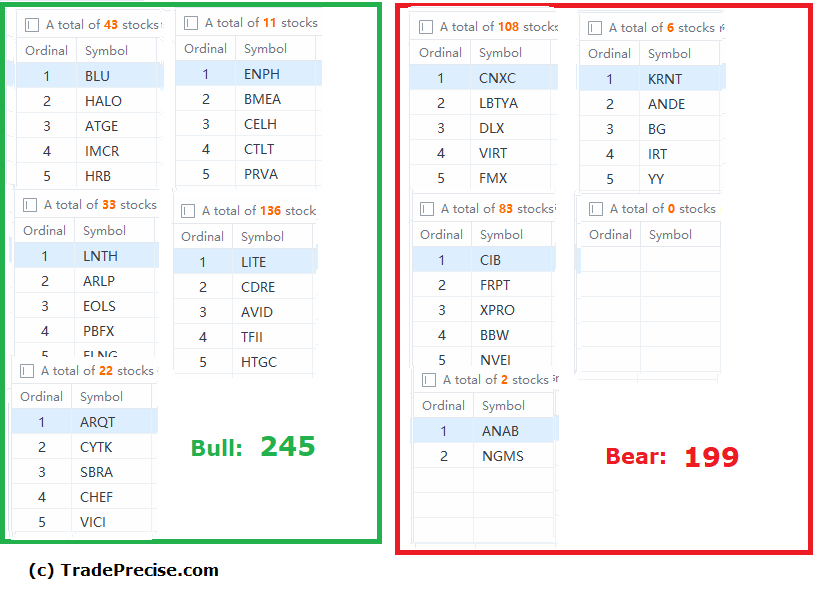
The bullish setup vs. the bearish setup is 245 to 199 from the screenshot of my stock screener below. The sharp drop in the bearish setup and mild increase in the bullish setup from last week are encouraging signs for the bullish scenario, which is also reflected in the improvement of the market breadth as explained last week.

Chart

Should the bottoming process unfold like the seasonality chart as shown in the video, outperforming stocks will start to move up and could be the future leadership in the next bull run. Visit TradePrecise.com to get more stock market insights in email for free.

Author

Ming Jong Tey

Ming Jong Tey

Independent Analyst

Ming Jong Tey has been trading since 2008. He started his learning journey from technical analysis (indicators, Fibonacci, etc...) to value investing. Throughout his journey, he develops an interest in price action with chart pattern trading.

More from Ming Jong Tey
Share:

Markets move fast. We move first.

Orange Juice Newsletter brings you expert driven insights - not headlines. Every day on your inbox.

By subscribing you agree to our Terms and conditions.

Editor's Picks

EUR/USD recovers to 1.1750 region as 2025 draws to a close

Following the bearish action seen in the European session on Wednesday, EUR/USD regains its traction and recovery to the 1.1750 region. Nevertheless, the pair's volatility remains low as trading conditions thin out on the last day of the year.

GBP/USD stays weak near 1.3450 on modest USD recovery

GBP/USD remains under modest beairsh pressure and fluctuates at around 1.3450 on Wednesday. The US Dollar finds fresh demand due to the end-of-the-year position adjustments, weighing on the pair amid the pre-New Year trading lull. 

Gold retreats to $4,300 area, looks to post monthly gains

Gold stays on the back foot on the last day of 2025 and trades near $4,300, possibly pressured by profit-taking and position adjustments. Nevertheless, XAU/USD remains on track to post gains for December and extend its winning streak into a fifth consecutive month.

Bitcoin, Ethereum and XRP prepare for a potential New Year rebound

Bitcoin, Ethereum, and Ripple are holding steady on Wednesday after recording minor gains on the previous day. Technically, Bitcoin could extend gains within a triangle pattern while Ethereum and Ripple face critical overhead resistance. 

Economic outlook 2026-2027 in advanced countries: Solidity test

After a year marked by global economic resilience and ending on a note of optimism, 2026 looks promising and could be a year of solid economic performance. In our baseline scenario, we expect most of the supportive factors at work in 2025 to continue to play a role in 2026.

Crypto market outlook for 2026

Year 2025 was volatile, as crypto often is.  Among positive catalysts were favourable regulatory changes in the U.S., rise of Digital Asset Treasuries (DAT), adoption of AI and tokenization of Real-World-Assets (RWA).