State Bank of India – SBI Elliott Wave technical analysis [Video]
![State Bank of India – SBI Elliott Wave technical analysis [Video]](https://editorial.fxsstatic.com/images/i/charts-01_XtraLarge.jpg)
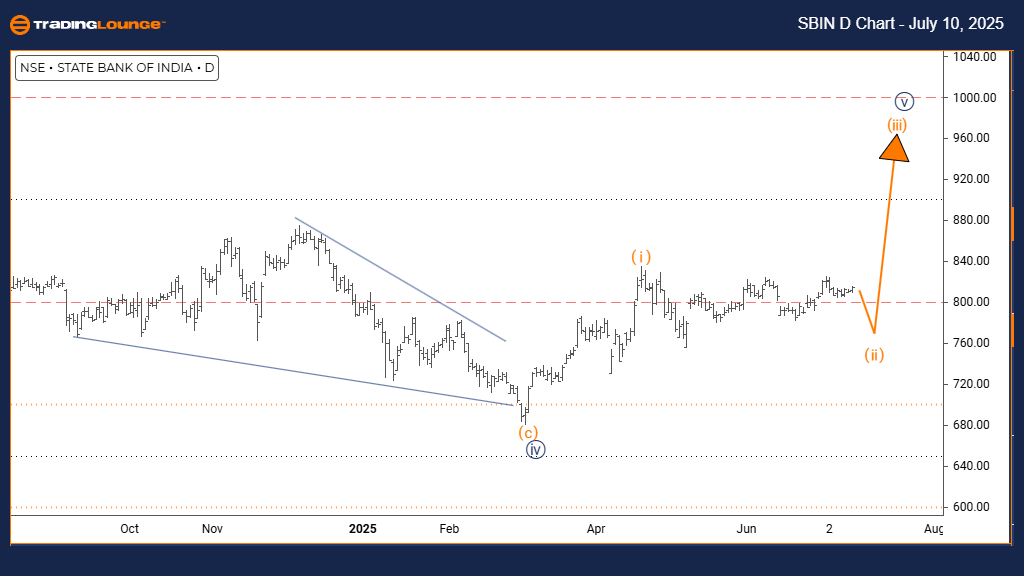
State Bank of India Elliott Wave technical analysis – Day chart
Function: Counter Trend.
Mode: Corrective.
Structure: Orange Wave 2.
Position: Navy Blue Wave 5.
Direction next higher degrees: Orange Wave 3.
Details: Orange Wave 1 appears to have completed; currently, Orange Wave 2 is active.
Technical overview
The daily chart analysis of State Bank of India (SBI) reveals a counter-trend scenario grounded in Elliott Wave principles. Presently, the price action reflects corrective movement, signaling the formation of Orange Wave 2 within the broader wave structure. This setup falls under Navy Blue Wave 5, indicating the possible conclusion of a larger downward trend. If this corrective wave finalizes, Orange Wave 3 could initiate, marking a potential shift in direction.
Market implications
Recent market behavior indicates that Orange Wave 1 has likely ended, transitioning into Orange Wave 2. This wave often denotes a pullback or short-term pause within the existing trend. Such corrective phases might suggest short-term upward movement before the prevailing trend resumes. The counter-trend nature of this setup means it’s more likely a temporary correction, not a new primary trend. Given the positioning within Navy Blue Wave 5, it may represent the final leg of the downtrend—commonly a precursor to a major reversal. Investors and traders should monitor for signs that Orange Wave 2 is nearing completion to prepare for the emergence of Orange Wave 3.
Trading strategy
This wave structure indicates potential short-term gains during the ongoing correction, although the larger trend remains unclear until further confirmation. The end of Orange Wave 1 offers the structural foundation for this counter-trend movement, signaling that SBI might be transitioning between directional trends. Given the complex nature of corrective moves, which are typically less predictable and more volatile than impulsive ones, traders should stay cautious and patient. Monitoring wave behavior closely will be critical in identifying actionable setups while navigating less favorable trading conditions during this phase.
This analysis gives essential context to SBI’s place in the broader Elliott Wave sequence. Observing the corrective wave’s progression is key to forecasting future price movement. The counter-trend categorization emphasizes the importance of tight risk management since corrective moves often defy predictable duration and retracement levels. This technical perspective provides actionable insights for traders aiming to anticipate key turning points in State Bank of India's market activity.
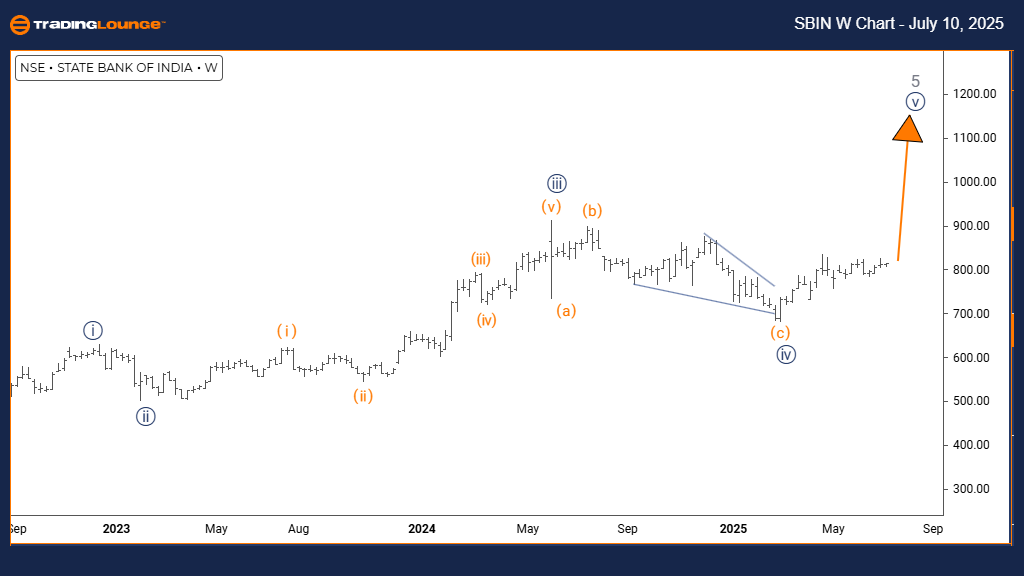
State Bank of India Elliott Wave technical analysis – Weekly chart
Function: Bullish Trend
Mode: Impulsive
Structure: Navy Blue Wave 5
Position: Gray Wave 5
Direction next higher degrees: Navy Blue Wave 5 (started)
Details: Navy Blue Wave 4 appears complete; Navy Blue Wave 5 is now active.
Weekly market overview
The weekly analysis of State Bank of India (SBI) reflects a bullish scenario under Elliott Wave theory. The chart shows an impulsive wave structure currently unfolding as Navy Blue Wave 5. This wave falls within the broader Gray Wave 5 formation, suggesting SBI might be reaching the final phase of its ongoing uptrend. The expected progression is Navy Blue Wave 5, which has likely started following the end of the previous correction.
Current price action
Recent technical observations show Navy Blue Wave 4 has completed, giving way to Navy Blue Wave 5. Typically, this phase represents the last significant push in an Elliott Wave cycle. Its impulsive behavior suggests continued upward movement supported by strong momentum. Traders may find short- to medium-term buying opportunities as the bullish phase progresses. However, due to its late-stage positioning, this wave often precedes a trend reversal or a substantial correction. The use of the weekly timeframe strengthens this outlook by capturing broader institutional and sentiment-driven activity.
Strategic implications
The technical signals indicate that SBI may be nearing the terminal point of its current bullish trend. As the structure of Navy Blue Wave 5 matures, traders and investors should be alert to reversal signals. The end of Navy Blue Wave 4 laid the groundwork for the ongoing upward move, and now the market is likely entering the final leg of this sequence. Given the nature of Wave 5, caution is advised, especially if divergences or momentum shifts become visible.
For long-term and medium-term investors, the weekly view helps eliminate short-term noise and focus on major trend developments. While the bullish outlook remains intact, recognizing signs of potential exhaustion will be key. Traders should monitor the price movement closely for signs of weakening strength as the wave sequence progresses. This analysis offers a reliable framework for evaluating the opportunity in SBI while also acknowledging emerging risks as the trend potentially peaks.
State Bank of India – SBI Elliott Wave technical analysis [Video]
Author

Peter Mathers
TradingLounge
Peter Mathers started actively trading in 1982. He began his career at Hoei and Shoin, a Japanese futures trading company.


