State Bank of India Elliott Wave technical analysis [Video]
![State Bank of India Elliott Wave technical analysis [Video]](https://editorial.fxstreet.com/images/Macroeconomics/Countries/Asia/India/indian-flag-19077818_XtraLarge.jpg)
SBIN Elliott Wave technical analysis
Function: Counter Trend (Minor degree, Grey).
Mode: Motive.
Structure: Impulse within larger degree zigzag.
Position: Minor Wave 2.
Details: Minor Wave 2 Grey might be now complete around 850 zone, which is also previous Wave ((iv)) of one lesser degree. If correct, expect Wave 3 to be underway soon.
Invalidation point: 910.
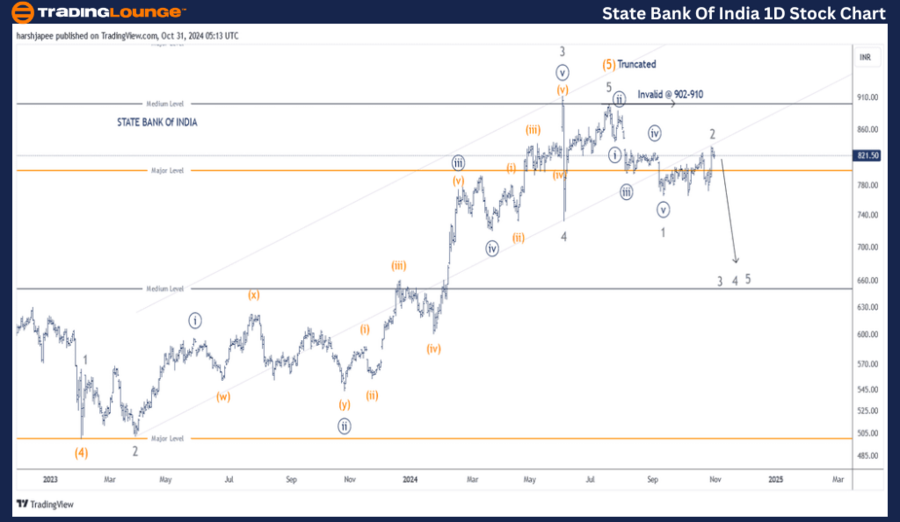
State Bank of India daily chart technical analysis and potential Elliott Wave counts:
State Bank of India daily chart is suggesting that the stock might have completed its larger degree uptrend around 910, with Intermediate Wave (5) Orange being truncated. Alternatively, Minor Wave 5 of (5) could be sub dividing/extending against 730 low.
State Bank of India terminated Intermediate Wave (4) Orange around 500 in February 2023. Thereafter Minor Waves 1 (Impulse), 2 (Expanded Flat), 3 (Impulse, Extension), 4 (Zigzag, sharp) and 5 (Truncated) can be seen unfolding through 910 high.
If the above is correct, the stock has now turned lower against 910 to produce a larger degree corrective drop. Further Minor Wave 1 (Impulse) and 2 (Flat) can be seen as complete around 840-50 zone. If the above holds well, Minor Wave 3 could be underway now.
SBIN Elliott Wave technical analysis
Function: Counter Trend (Minor degree, Grey).
Mode: Motive.
Structure: Impulse within larger degree zigzag.
Position: Minor Wave 2.
Details: Minor Wave 2 Grey might be now complete around 850 zone, which is also previous Wave ((iv)) of one lesser degree. If correct, expect Wave 3 to be underway soon. Fibonacci 0.50 of Wave 1 has been tested, possibility remains for a 0.618 test before Wave 3 resumes.
Invalidation point: 910.
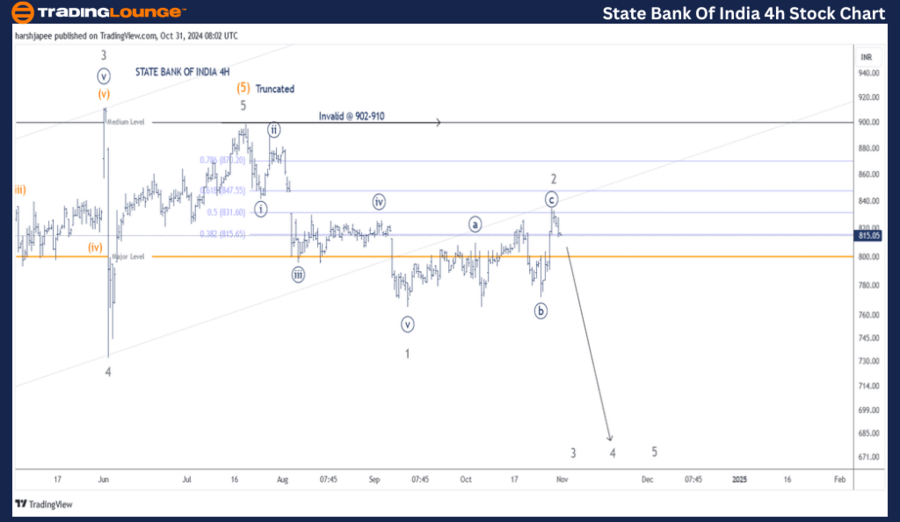
State Bank of India four-hour chart technical analysis and potential Elliott Wave counts:
State Bank of India 4H chart highlights the sub waves after Minor Wave 3 termination around 910. Minor Wave 4 was sharp and terminated around 730 on June 04, 2024. Minor Wave 5 might be seen as a Truncation around 900 levels.
If correct, a larger degree corrective wave is now underway and Minor Waves 1 and 2 are already complete 765 and 840-50 respectively. Alternatively, Minor Wave 5 is extending and prices should continue above the 900 mark.
Conclusion
State Bank of India is progressing lower with Minor Wave 3 Grey to resume lower against 910 levels.
State Bank of India Elliott Wave technical analysis [Video]
Author

Peter Mathers
TradingLounge
Peter Mathers started actively trading in 1982. He began his career at Hoei and Shoin, a Japanese futures trading company.


