|

$SPY Elliott Wave: Bullish sequences calling the rally

In this technical blog we’re going to take a quick look at the Elliott Wave charts of SPY published in membership area of the website.  As our members know, SPY is showing incomplete bullish sequences in the cycle from the 12.22.2022 low . That makes the ETF bullish against the 387.22 pivot. Recently SPY has given us short term correction. We got 3 waves pull back which found buyers right at equal legs area as we expected.  In the further text we are going to explain the Elliott Wave Forecast and trading setup.

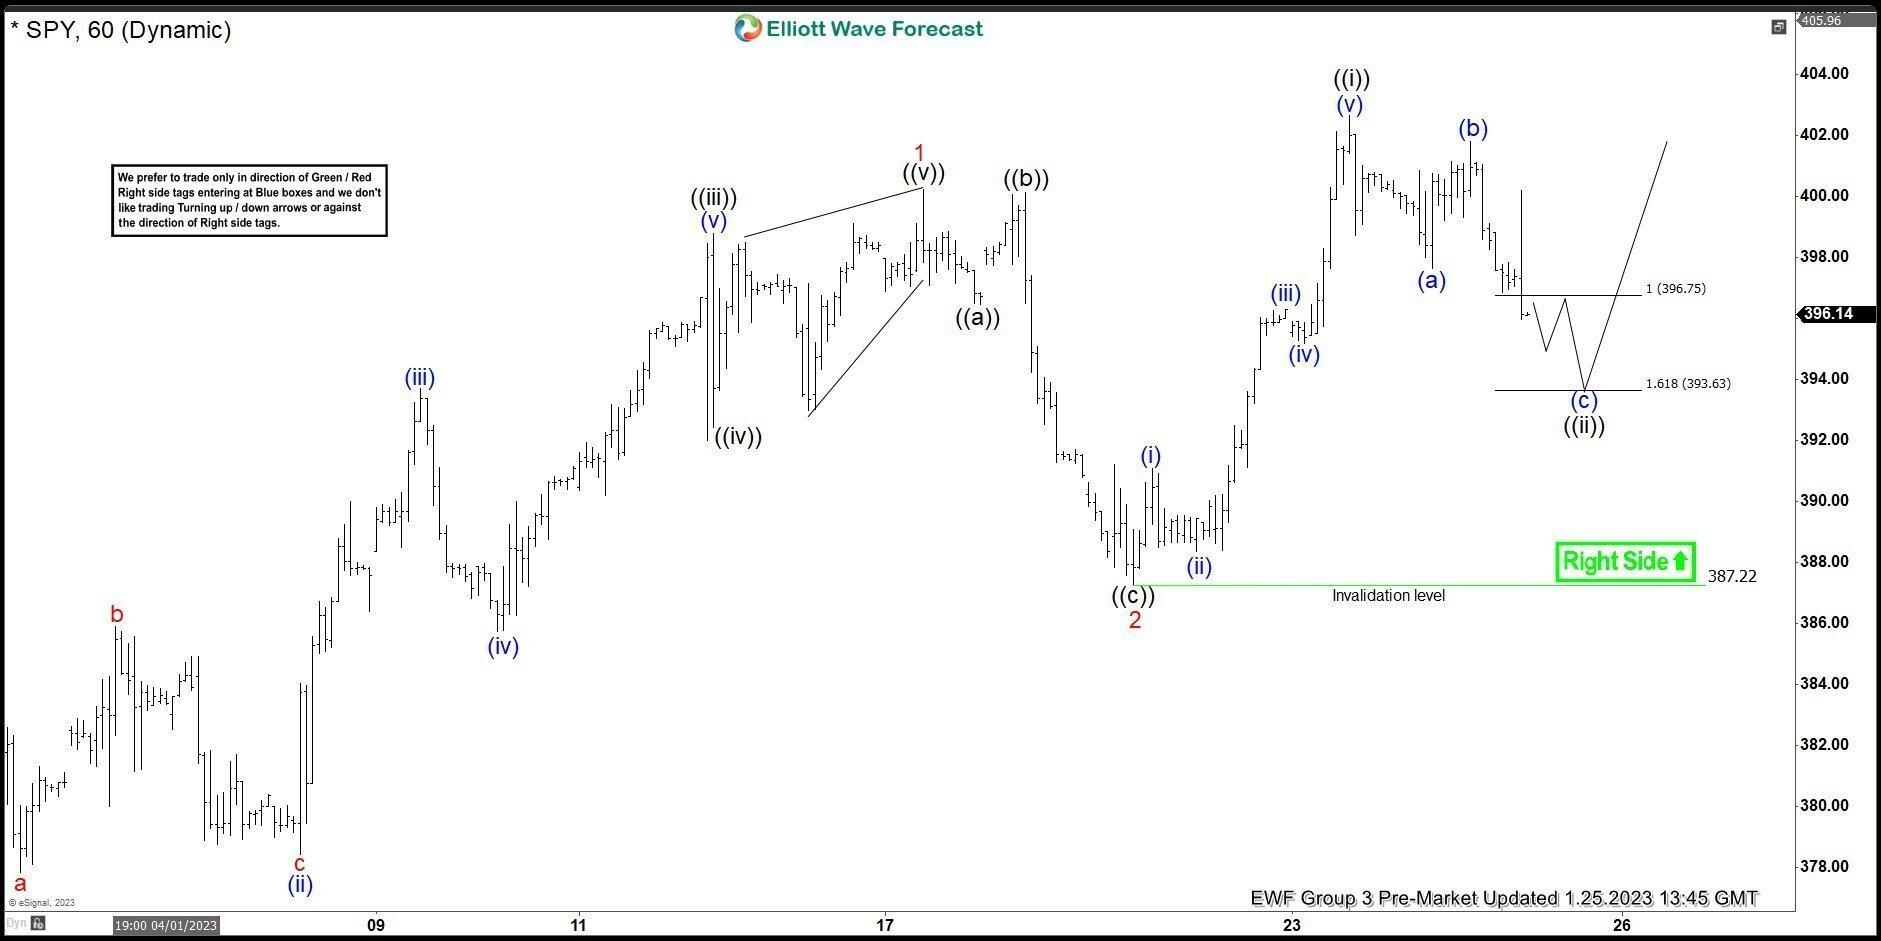
SPY 1h Elliott Wave analysis 1.25.2023

SPY made 5 waves up in the cycle from the December 22nd low. Break of 1 red peak ( 01.17)  made the ETF bullish against the 387.22 low. Currently we are getting 3 waves pull back which is correcting the cycle from the mentioned low. Equal legs area is already reached at 396.75-393.63 and from there we expect to see turn higher. As the ETF is currently in bullish cycle, we expect buyers to appear at the marked area for further rally toward new highs ideally.

SPY

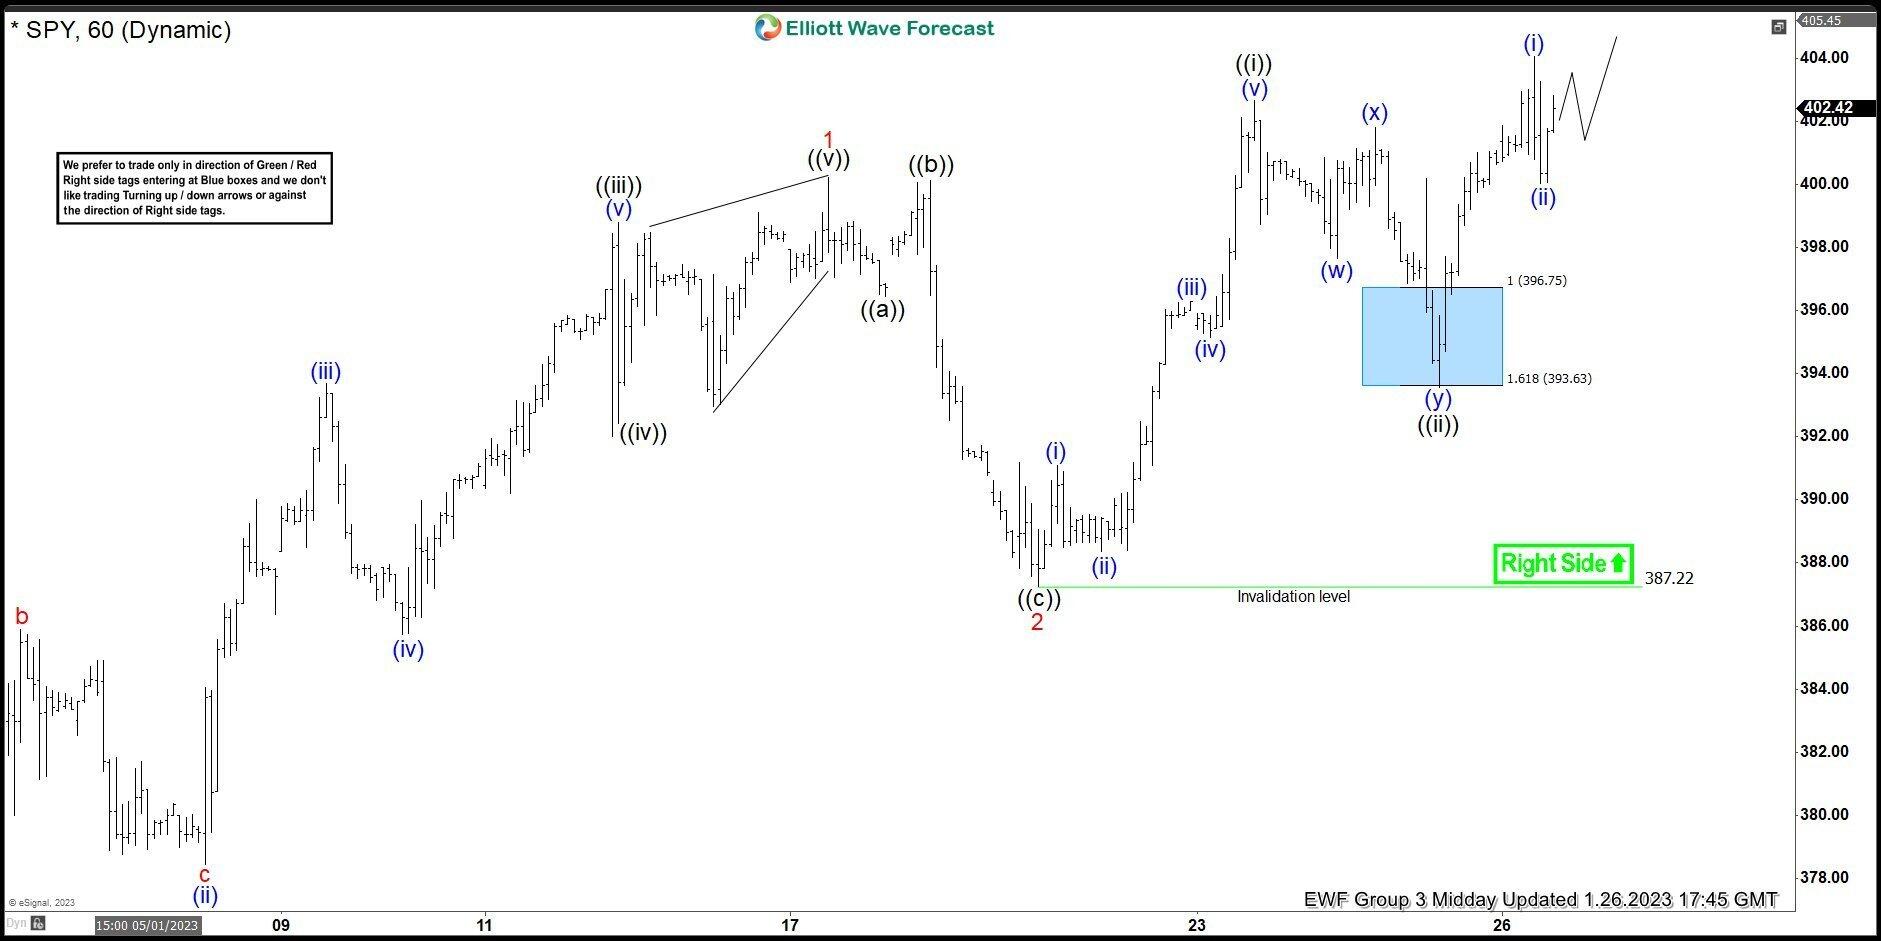
SPY 1h Elliott Wave analysis 1.26.2023

SPY found buyers at the equal legs area :396.75-393.63 as expected. Pull back ((ii)) black ended at 393.6 low.  We got nice rally toward new highs. As a result, members who took short trades mad positions risk free.  ( Put SL at BE) and took partial profits.

SPY

Author

Elliott Wave Forecast Team

Elliott Wave Forecast Team

ElliottWave-Forecast.com

More from Elliott Wave Forecast Team
Share:

Editor's Picks

EUR/USD tests nine-day EMA support near 1.1850

EUR/USD inches lower during the Asian hours on Monday, trading around 1.1870 at the time of writing. The 14-day Relative Strength Index momentum indicator at 56 stays above the midline, confirming improving momentum. RSI has cooled from prior overbought readings but stabilizes above 50, suggesting dips could stay limited before buyers reassert control.

GBP/USD flat lines as traders await key UK macro data and FOMC minutes

The GBP/USD pair kicks off a new week on a subdued note and oscillates in a narrow range, just below mid-1.3600s, during the Asian session. Moreover, the mixed fundamental backdrop warrants some caution for aggressive traders as the market focus now shifts to this week's important releases from the UK and the US.

Gold slides below $5,000 amid USD uptick and positive risk tone; downside seems limited

Gold attracts fresh sellers at the start of a new week and reverses a part of Friday's strong move up of over $150 from sub-$4,900 levels. The commodity slides back below the $5,000 psychological mark during the Asian session, though the downside potential seems limited amid a combination of supporting factors.

Bitcoin, Ethereum and Ripple consolidate within key ranges as selling pressure eases

Bitcoin and Ethereum prices have been trading sideways within key ranges following the massive correction. Meanwhile, XRP recovers slightly, breaking above the key resistance zone. The top three cryptocurrencies hint at a potential short-term recovery, with momentum indicators showing fading bearish signs.

Global inflation watch: Signs of cooling services inflation

Realized inflation landed close to expectations in January, as negative base effects weighed on the annual rates. Remaining sticky inflation is largely explained by services, while tariff-driven goods inflation remains limited even in the US.

Ripple Price Forecast: XRP potential bottom could be in sight

Ripple edges up above the intraday low of $1.35 at the time of writing on Friday amid mixed price actions across the crypto market. The remittance token failed to hold support at $1.40 the previous day, reflecting risk-off sentiment amid a decline in retail and institutional sentiment.