|

SPY confirms Elliott Wave mastery with blue box rally

In this technical blog, we will look at the past performance of the 1-hour Elliott Wave Charts of SPY. We presented to members at the elliottwave-forecast. In which, the rally from the 21 November 2025 low is unfolded as an impulse structure. Also showed a higher high sequence suggested that ETF should see more upside extension to complete the impulse sequence. Therefore, we advised members not to sell the ETF & buy the dips in 3, 7, or 11 swings at the blue box areas. We will explain the structure & forecast below:

SPY one-hour Elliott Wave chart from 12.17.2025

SPY

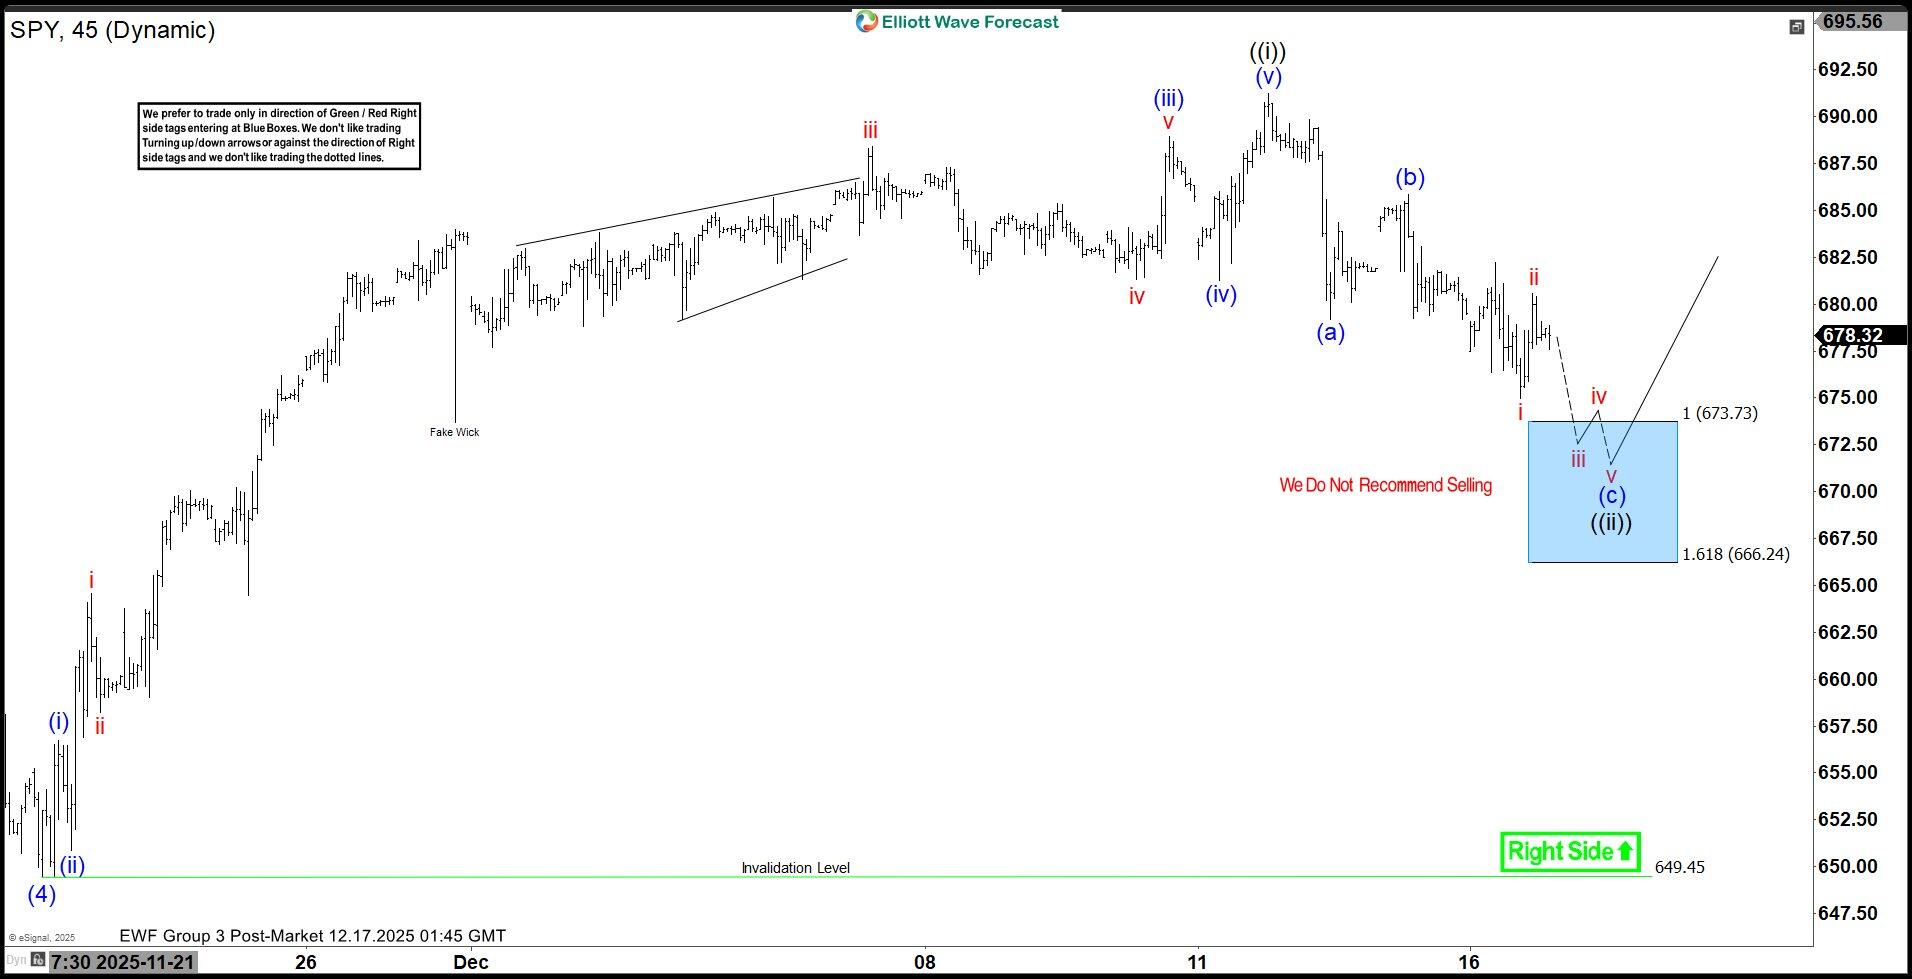
Here’s the 1-hour Elliott wave chart from the 12.17.2025 Post-Market update. In which, the short-term cycle from the 11.21.2025 low ended in wave ((i)) as impulse at $691.24 high. Down from there, the ETF made a pullback in wave ((ii)) to correct that cycle. The internals of that pullback unfolded as Elliott wave zigzag structure where wave (a) ended at $679.17 low. Wave (b) bounce ended at $685.87 high. Then wave (c) managed to reach the blue box area at $673.73- $649.45. From there, buyers were expected to appear looking for the next leg higher or for a 3 wave bounce minimum.

SPY latest one-hour Elliott Wave chart from 12.30.2025

SPY

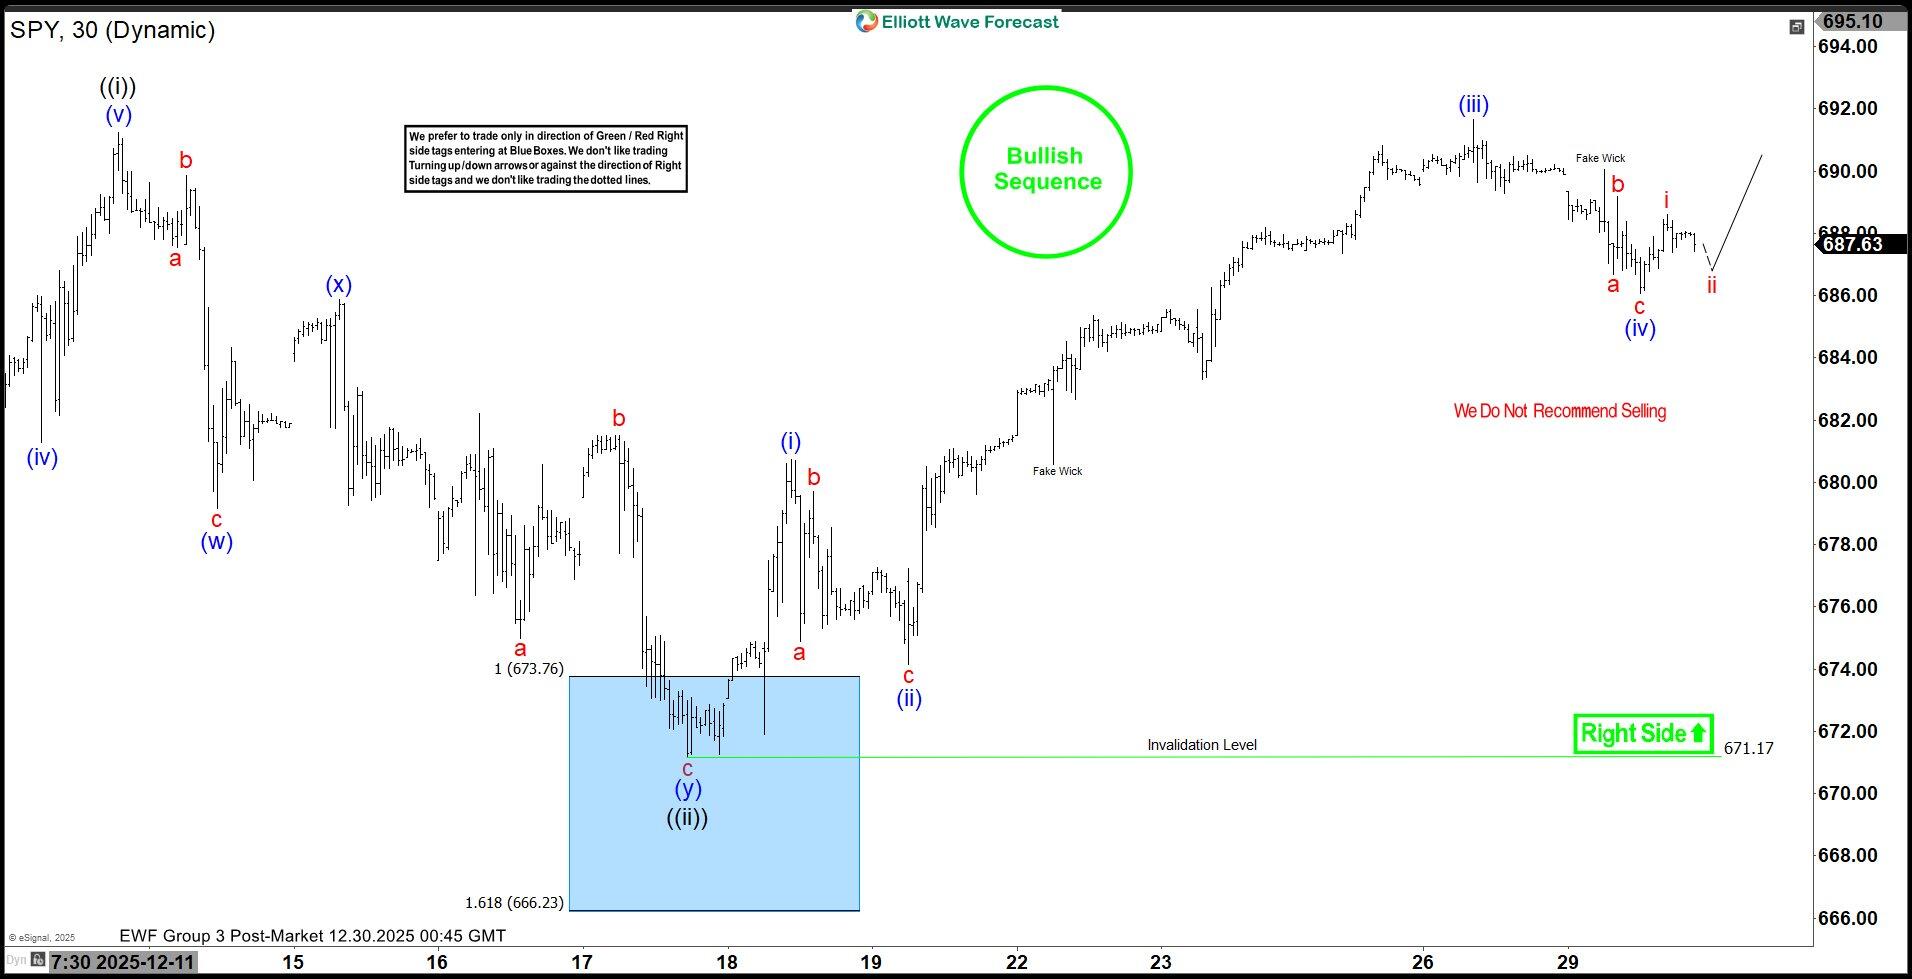
This is the 1-hour Elliott wave Chart from the 12.30.2025 Post-Market update. In which the ETF is showing a reaction higher taking place, right after ending the correction within the blue box area. Allowed members to create a risk-free position shortly after taking the long position at the blue box area. Since then, SPY has already made a new high targeting $712.96- $722.81 area higher minimum before profit taking & next pullback takes place in 3, 7 or 11 swings.

Author

Elliott Wave Forecast Team

Elliott Wave Forecast Team

ElliottWave-Forecast.com

More from Elliott Wave Forecast Team
Share:

Markets move fast. We move first.

Orange Juice Newsletter brings you expert driven insights - not headlines. Every day on your inbox.

By subscribing you agree to our Terms and conditions.

Editor's Picks

EUR/USD ticks lower following the release of FOMC Minutes

The US Dollar found some near-term demand following the release of the FOMC meeting minutes, with the EUR/USD pair currently piercing the 1.1750 threshold. The document showed officials are still willing to trim interest rates. Meanwhile, thinned holiday trading keeps major pairs confined to familiar levels.

GBP/USD remains sub- 1.3500, remains in the red

The GBP/USD lost traction early in the American session, maintaining the sour tone and trading around 1.3460 following the release of the FOMC meeting minutes. Trading conditions remain thin ahead of the New Year holiday, limiting the pair's volatility.

Gold stable above $4,350 as the year comes to an end

Gold price got to recover some modest ground on Tuesday, holding on to intraday gains and changing hands at $4,360 a troy ounce in the American afternoon. The bright metal showed no reaction to the release of the FOMC December meeting minutes.

Ethereum: ETH holds above $2,900 despite rising selling activity

Ethereum (ETH) held the $2,900 level despite seeing increased selling pressure over the past week. The Exchange Netflow metric showed deposits outweighed withdrawals by about 400K ETH. The high value suggests rising selling activity amid the holiday season.

Economic outlook 2026-2027 in advanced countries: Solidity test

After a year marked by global economic resilience and ending on a note of optimism, 2026 looks promising and could be a year of solid economic performance. In our baseline scenario, we expect most of the supportive factors at work in 2025 to continue to play a role in 2026.

Crypto market outlook for 2026

Year 2025 was volatile, as crypto often is.  Among positive catalysts were favourable regulatory changes in the U.S., rise of Digital Asset Treasuries (DAT), adoption of AI and tokenization of Real-World-Assets (RWA).