SPDR S&P 500 ETF Trust (SPY) Stock Price and Forecast: Why did the S&P 500 rally on Monday afternoon?
- S&P 500 stages a massive intraday turnaround on Monday.
- Dow Jones rallied over 1,000 points from an intraday low on Monday.
- Equity markets are falling again on Tuesday, but the Fed meeting may reduce volumes.

An incredible session on Monday with wild swings and a huge afternoon rally. Stocks opened the session and looked to be carrying on and even accelerating recent losses with most main indices down 4% by the halfway stage of the day. However, some signs of life in risk appetites showed, most notably from Bitcoin as it went positive for the day. This rally then spread across most equities and indices.
S&P 500 (SPY) Stock News
We put the majority of the price action yesterday down to two main factors. Firstly, position closing ahead of the Fed meeting, starting today, and a massive earnings week. Many commentators are attributing this move to a buy-the-dip philosophy, and that may have some credence, but the lack of follow through so far in Europe this morning is giving that argument less strength.
We have two major focuses this week to make investors reduce positions and wait. First, the Fed meeting is more interesting than usual given the economic backdrop and market action in 2022. Does the Fed hold the line of its recent hawkish tilt, or have markets unnerved some Fed members? Recent PMI data and consumer sentiment data are weakening. Second, this is the most important week on the earnings calendar. There are 104 companies from the S&P 500 (SPY) (SPX) reporting this week. Notably, Microsoft (MSFT), Apple (AAPL), Tesla (TSLA), General Electric (GE), McDonalds (MCD), Caterpillar and Chevron (CVX). A broad spectrum from tech to oil to consumer. This will give a broad picture then not only of company outlook but the general economic outlook. No wonder then that traders are reducing positions ahead of the data.
S&P 500 (SPY) Price Forecast
Yesterday was the first day since June 2020 that the S&P 500 (SPY) has opened below its 200-day moving average. This led to technical selling, which accelerated as the session wore on. Key support at $428 saw more stops likely generated below, and the price accelerated yet again. However, eventually that led to exhaustion and the price had only one option: to recover.
However, a key sign is the lack of volume behind the afternoon recovery. The majority of volume was triggered on the fall during the first half of the session. The rally was on light volume. This adds to our thesis that the recovery was merely based on exhaustion and not a genuine buy-the-dip recovery. Witness the SPY 15-minute chart below. The point of control was at $428, i.e. price with the highest volume. Above $430 there was a very low level of volume.
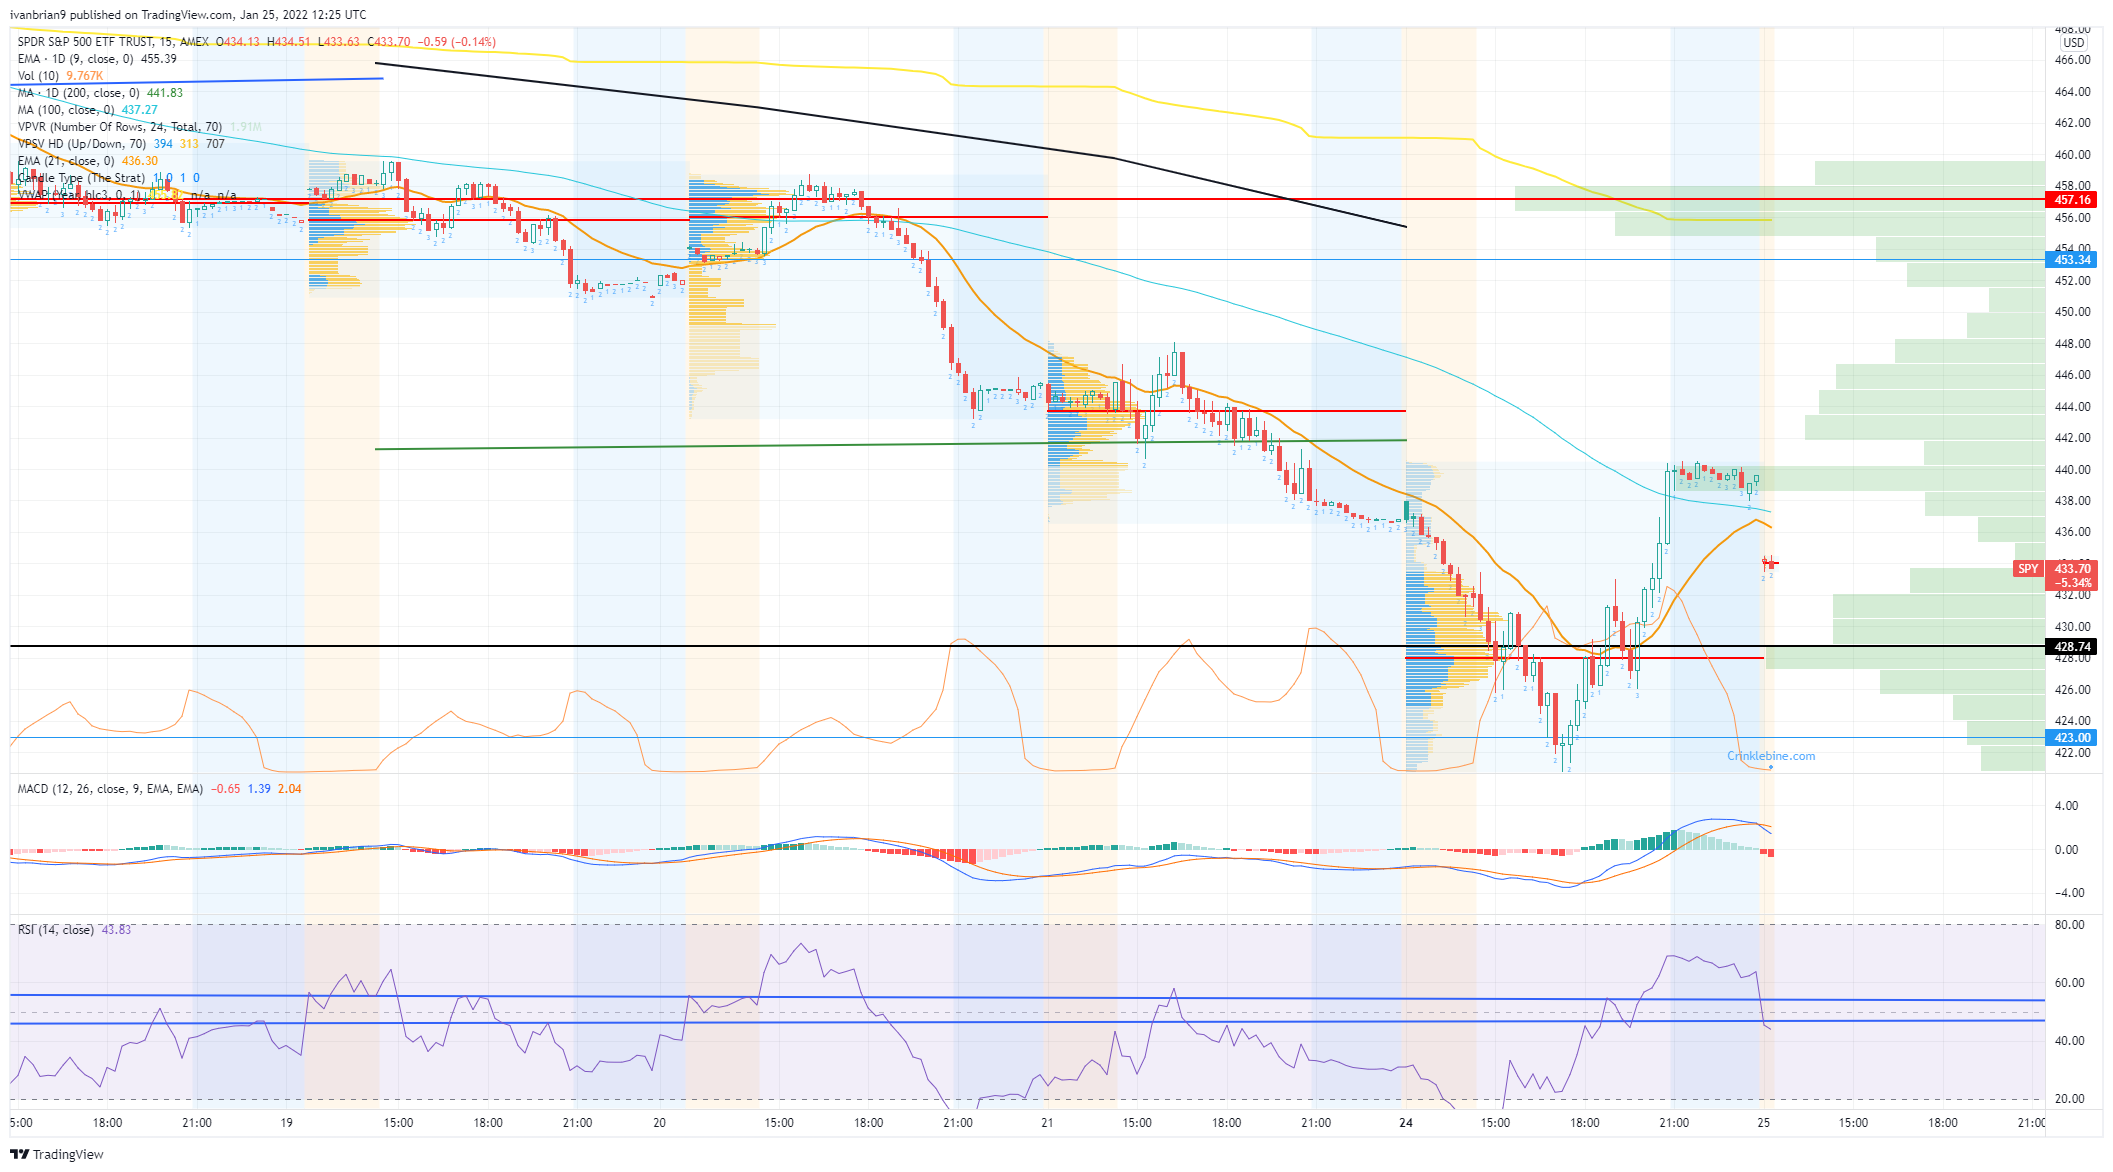
S&P 500 (SPY) chart, 15 minute
The daily chart shows the significance of that $428 level. This is the low from October, the last significant low of the current long-term uptrend. A break lower creates a new low and so a new downtrend. This makes it a huge level to hold. Holding also puts in place a bullish double bottom. $428 then is our pivot. Yes, we did spike lower, but the close is the more significant. Closing below $428 will see more losses and a move to $404 in our view. The longer $428 holds the more power bulls gain and the more likehood of a sustained bounce. That will bring the 200-day at $442 as the next key resistance.
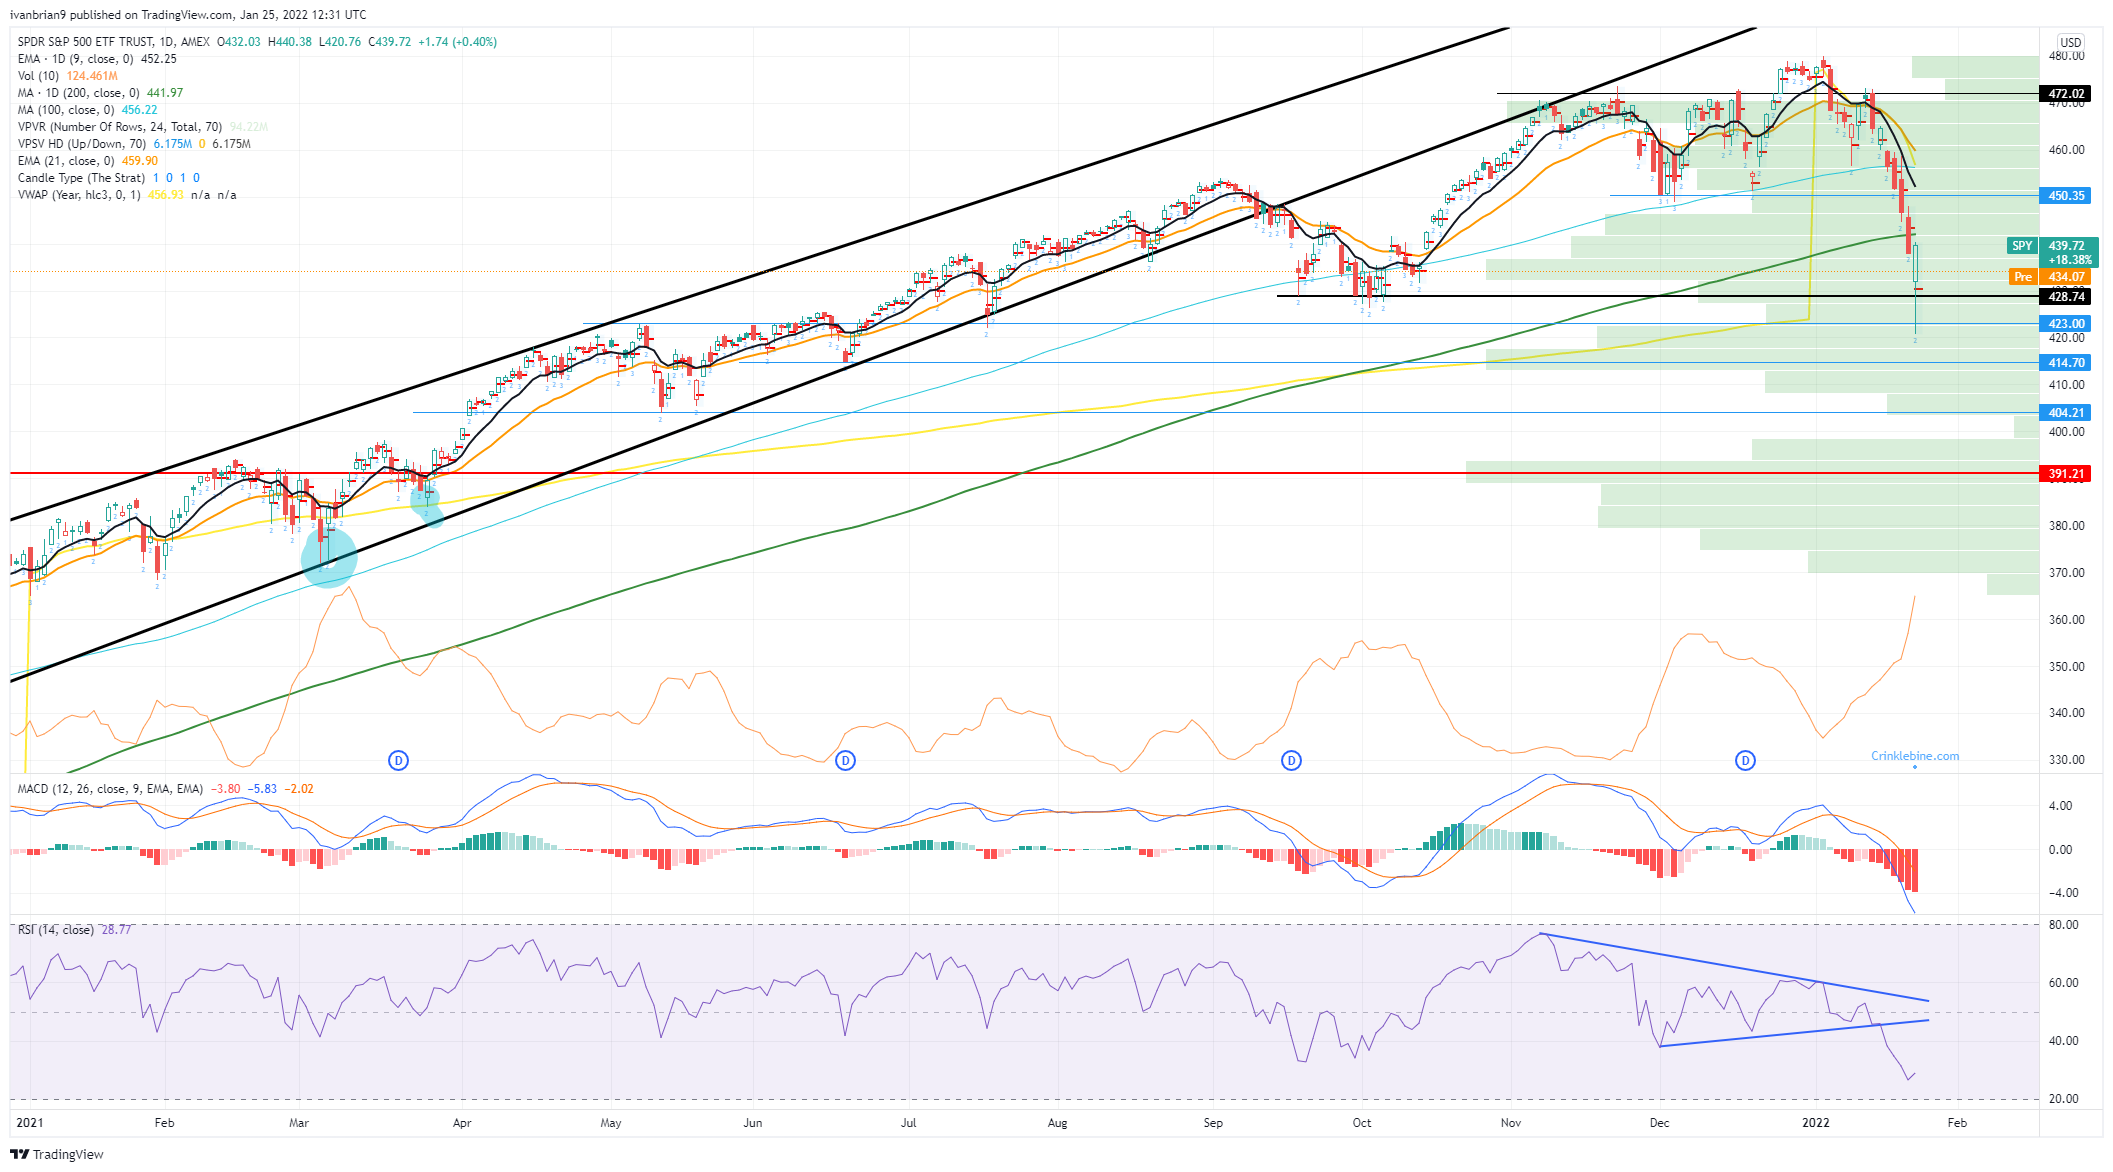
S&P 500 (SPY) chart, daily
Author

Ivan Brian
FXStreet
Ivan Brian started his career with AIB Bank in corporate finance and then worked for seven years at Baxter. He started as a macro analyst before becoming Head of Research and then CFO.


