SPDR S&P 500 ETF Trust (SPY) Stock News and Forecast: Will the SPY ever go down?
- SPY sets yet another record high on Monday.
- Stocks had looked to be falling on Monday in early trading.
- The afternoon rally ensures more records for SPY.
Monday looked set to be a down day finally for the equity market and for the SPY stock, but an afternoon rally made sure that the record-breaking run of breaking records continues. 2021 is on course to be the best year of record-high closes in history with only a few years in the 1990s still in the running, but we still have over four months to go, including the traditionally bullish festive season. When you look back to the 1990s it does set some worrying precedents as that eventually gave way to the Dot-Com crash. There are some worrying stretched valuations in evidence in the current cycle, but it does not look like time to step off the train just yet. The global backdrop of ultra-loose fiscal policy, money printing and negative interest rates offers a strong backdrop to equities. With little alternative offered by other asset classes, the money just keeps flowing into equities. Added to this backdrop has been stellar results from another earnings season, and companies and households awash with cash having hoarded it during the pandemic. Households are splurging on cars, renovations and investments, while companies are splurging on M&A, SPACs and now buybacks. Most companies were in a blackout period during earnings season but are now free to go back into the market and buy back shares.
The Market Ear wrote on Monday: "Average yearly inflow for the past 25 years is ~$29 Billion per year or +$115 Million per day...2021 is averaging (153 trading days) +$3.98 Billion per day"
SPY stock forecast
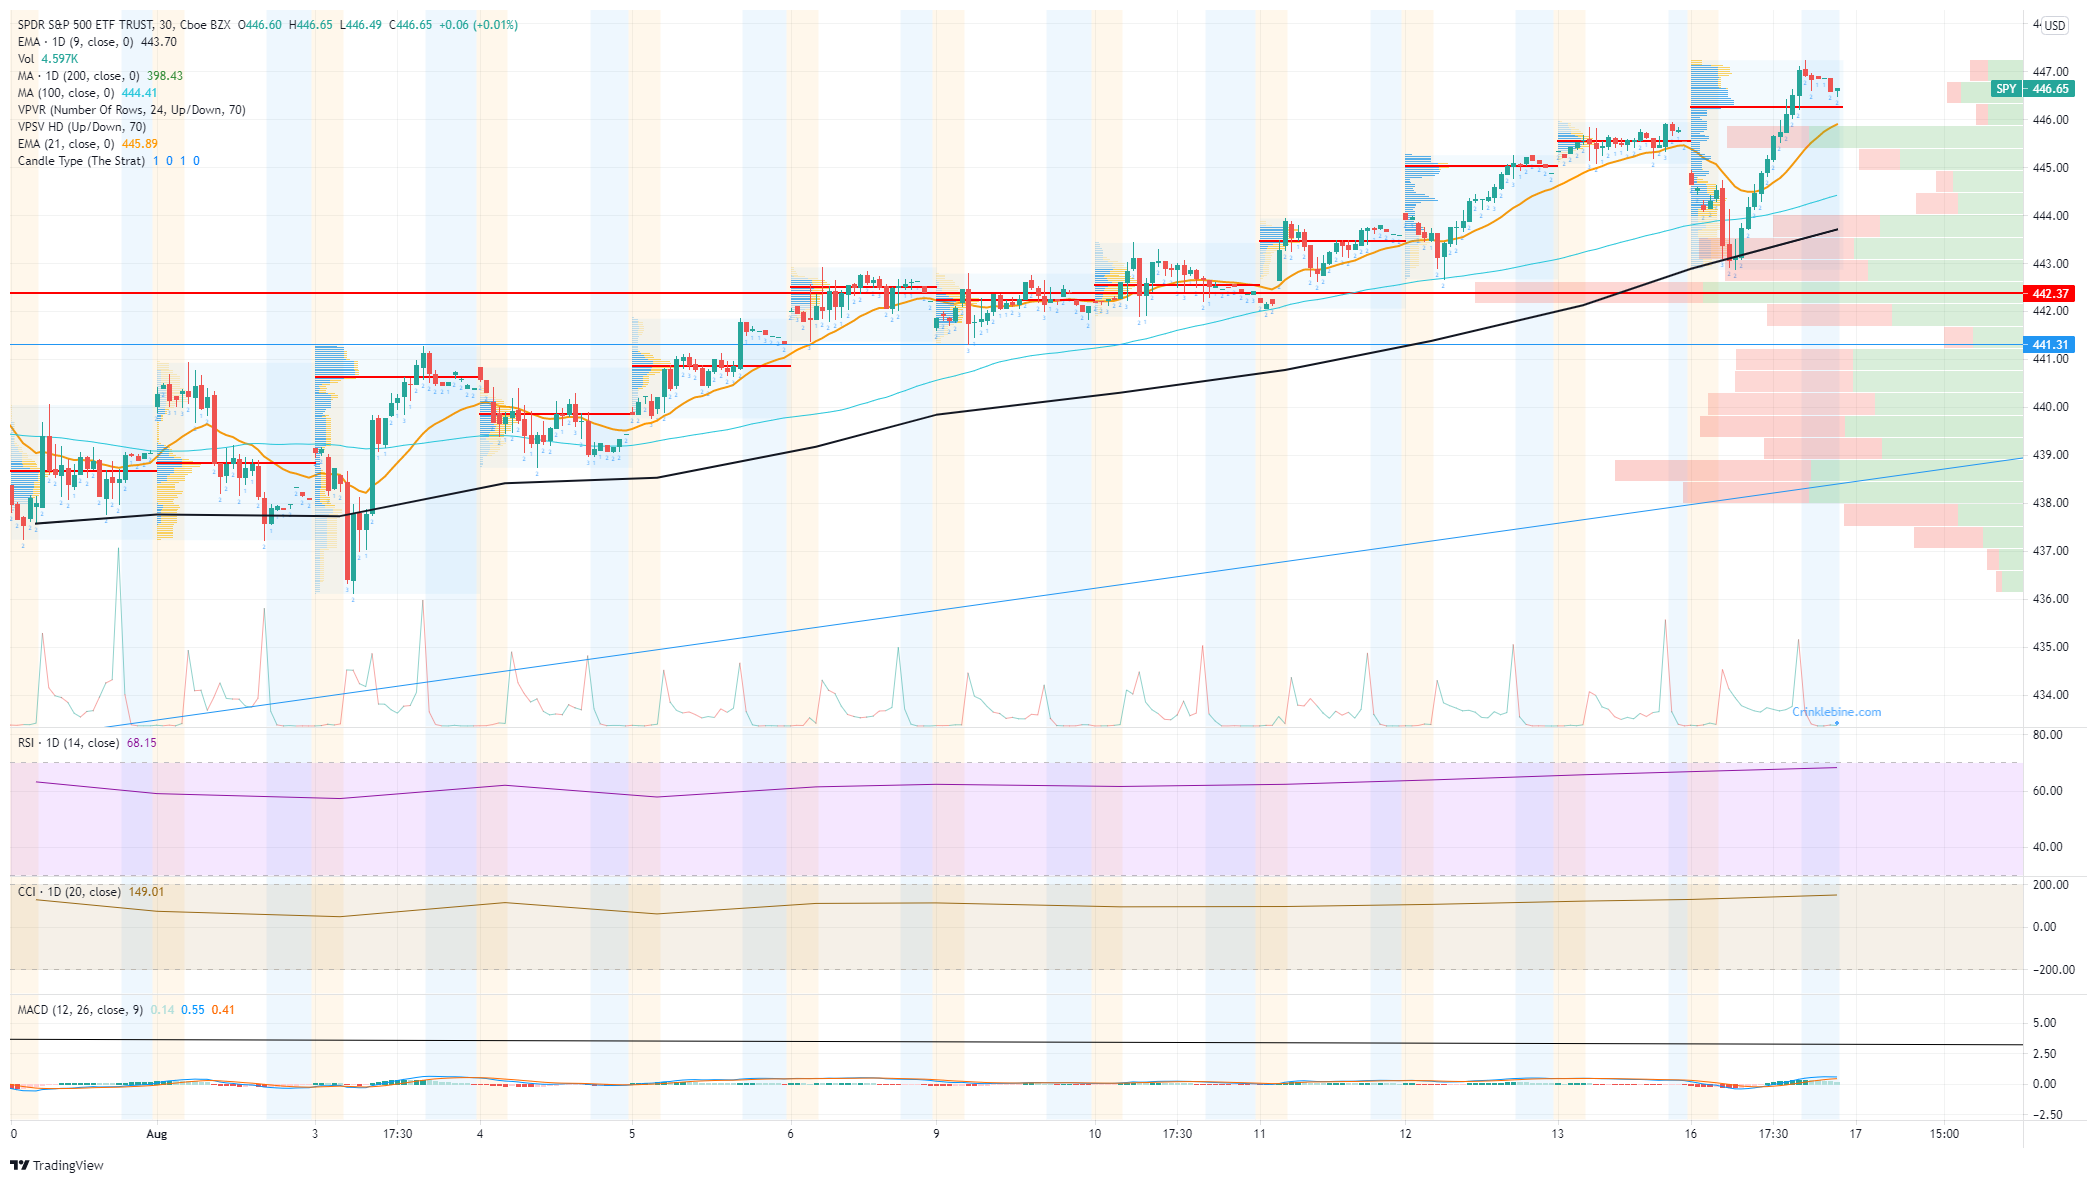
When we look at the 30-minute chart, the rejection of lower prices straight from the open is not too surprising. The recent volume profile shows volume skewed predominately toward the top of the daily range. $442.37 was the point of control for the month of August so far. This is the price with the maximum amount of volume, and as such it acts as an equilibrium. The SPY traded down to test it early in Monday's session, but buyers swiftly stepped in. Currently, the intraday support is at $445 from the August volume profile with Monday's point of control at $446.
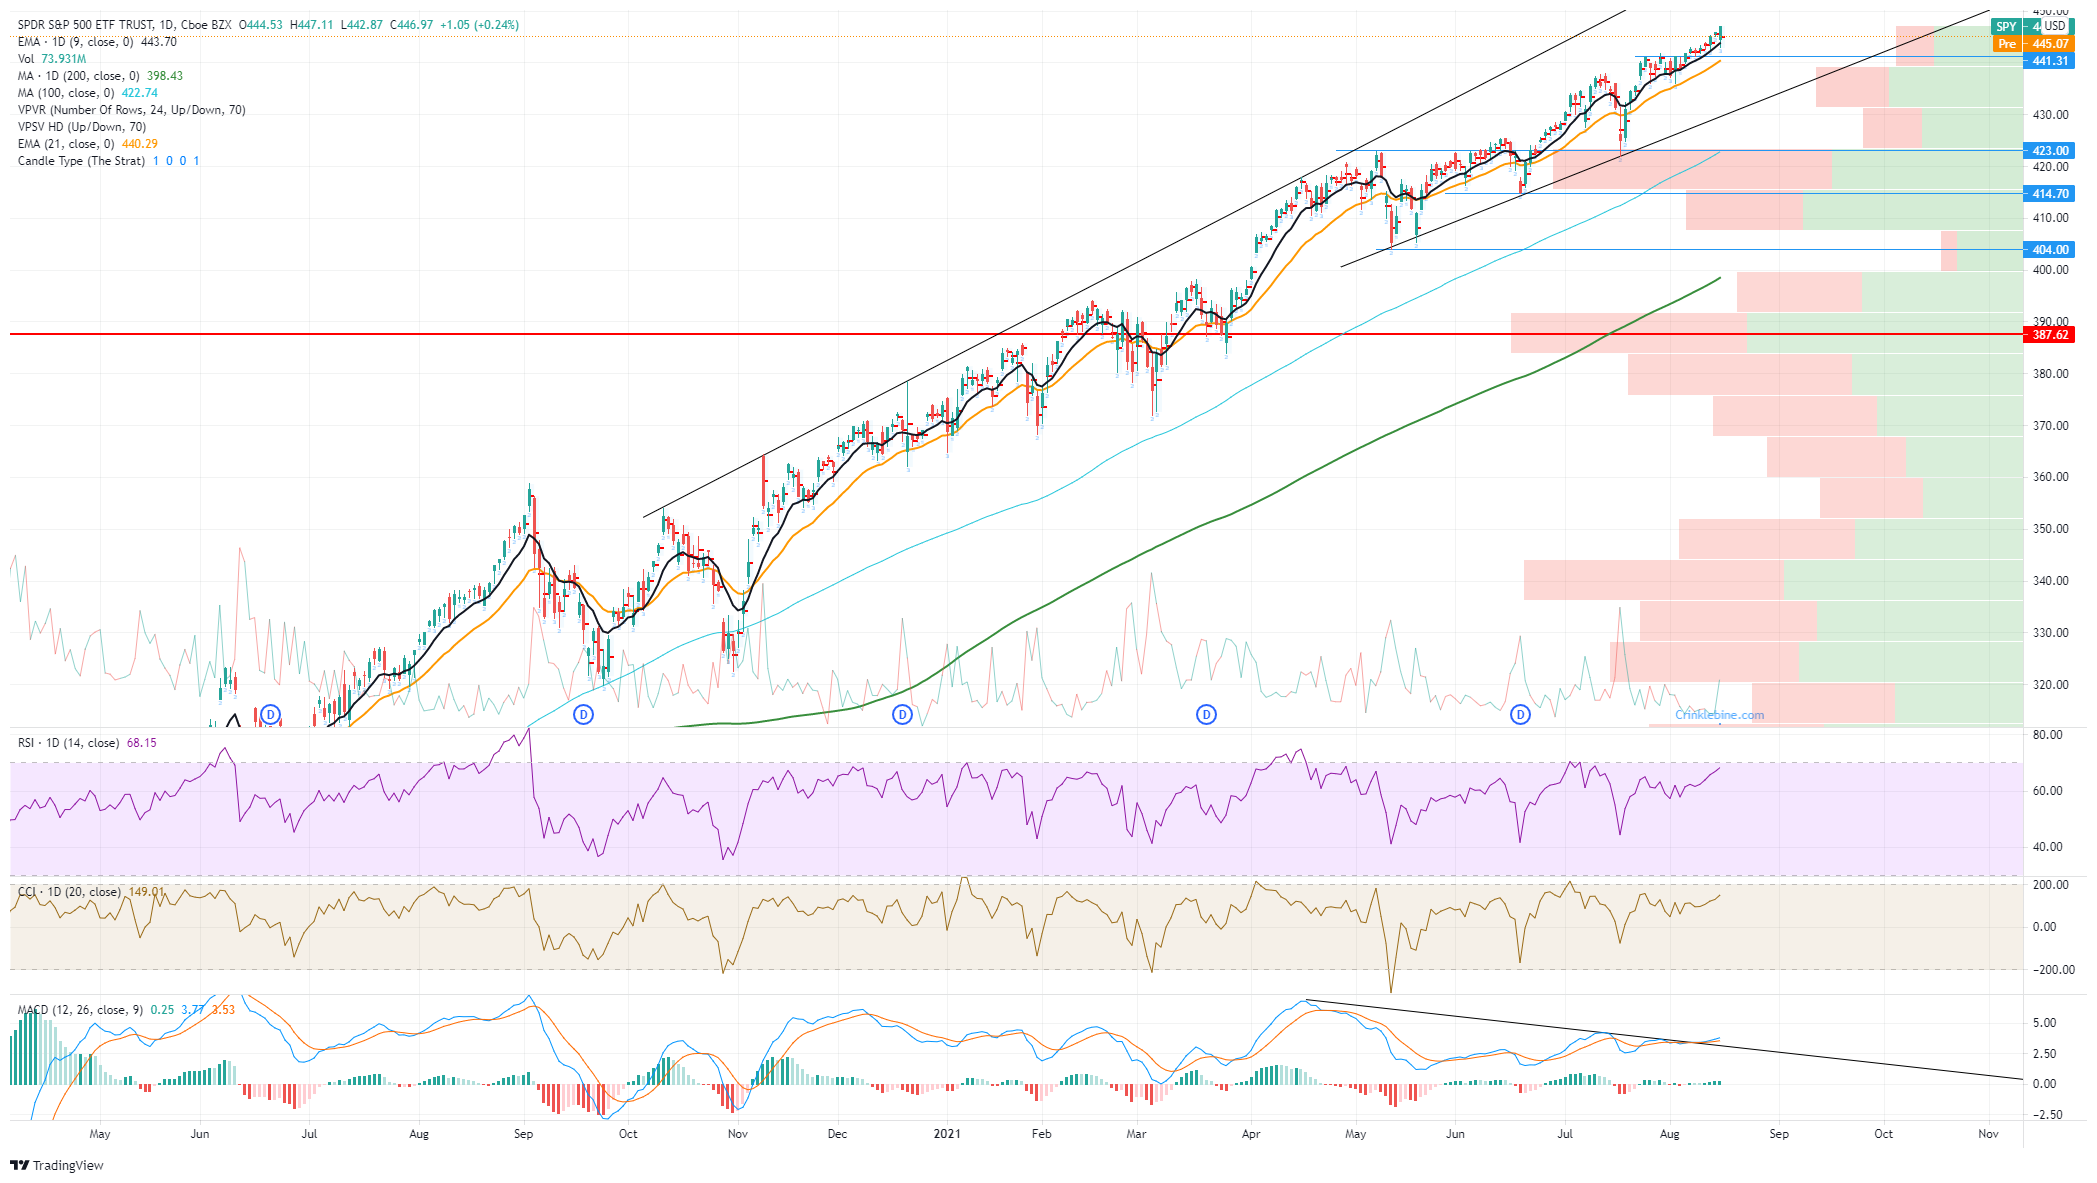
The daily chart gives us the key support levels, and we can see the volume levels to keep an eye on from the profile bars on the right. $441.31 is the short-term pivot with a break likely seeing a move to $423 as volume is not strong enough. $423 is very strong volume support and also the last buy-the-dip opportunity. The double bottom at $404 was also a big level and will act as support in the event of a larger pullback. Based on the most recent series of dip buying pullbacks, the next one should test our trend line at $430. Otherwise, it is onward and upwards: all momentum indicators are trending higher with price and the Moving Average Convergence Divergence (MACD) indicator has just broken the bearish divergence downtrend.
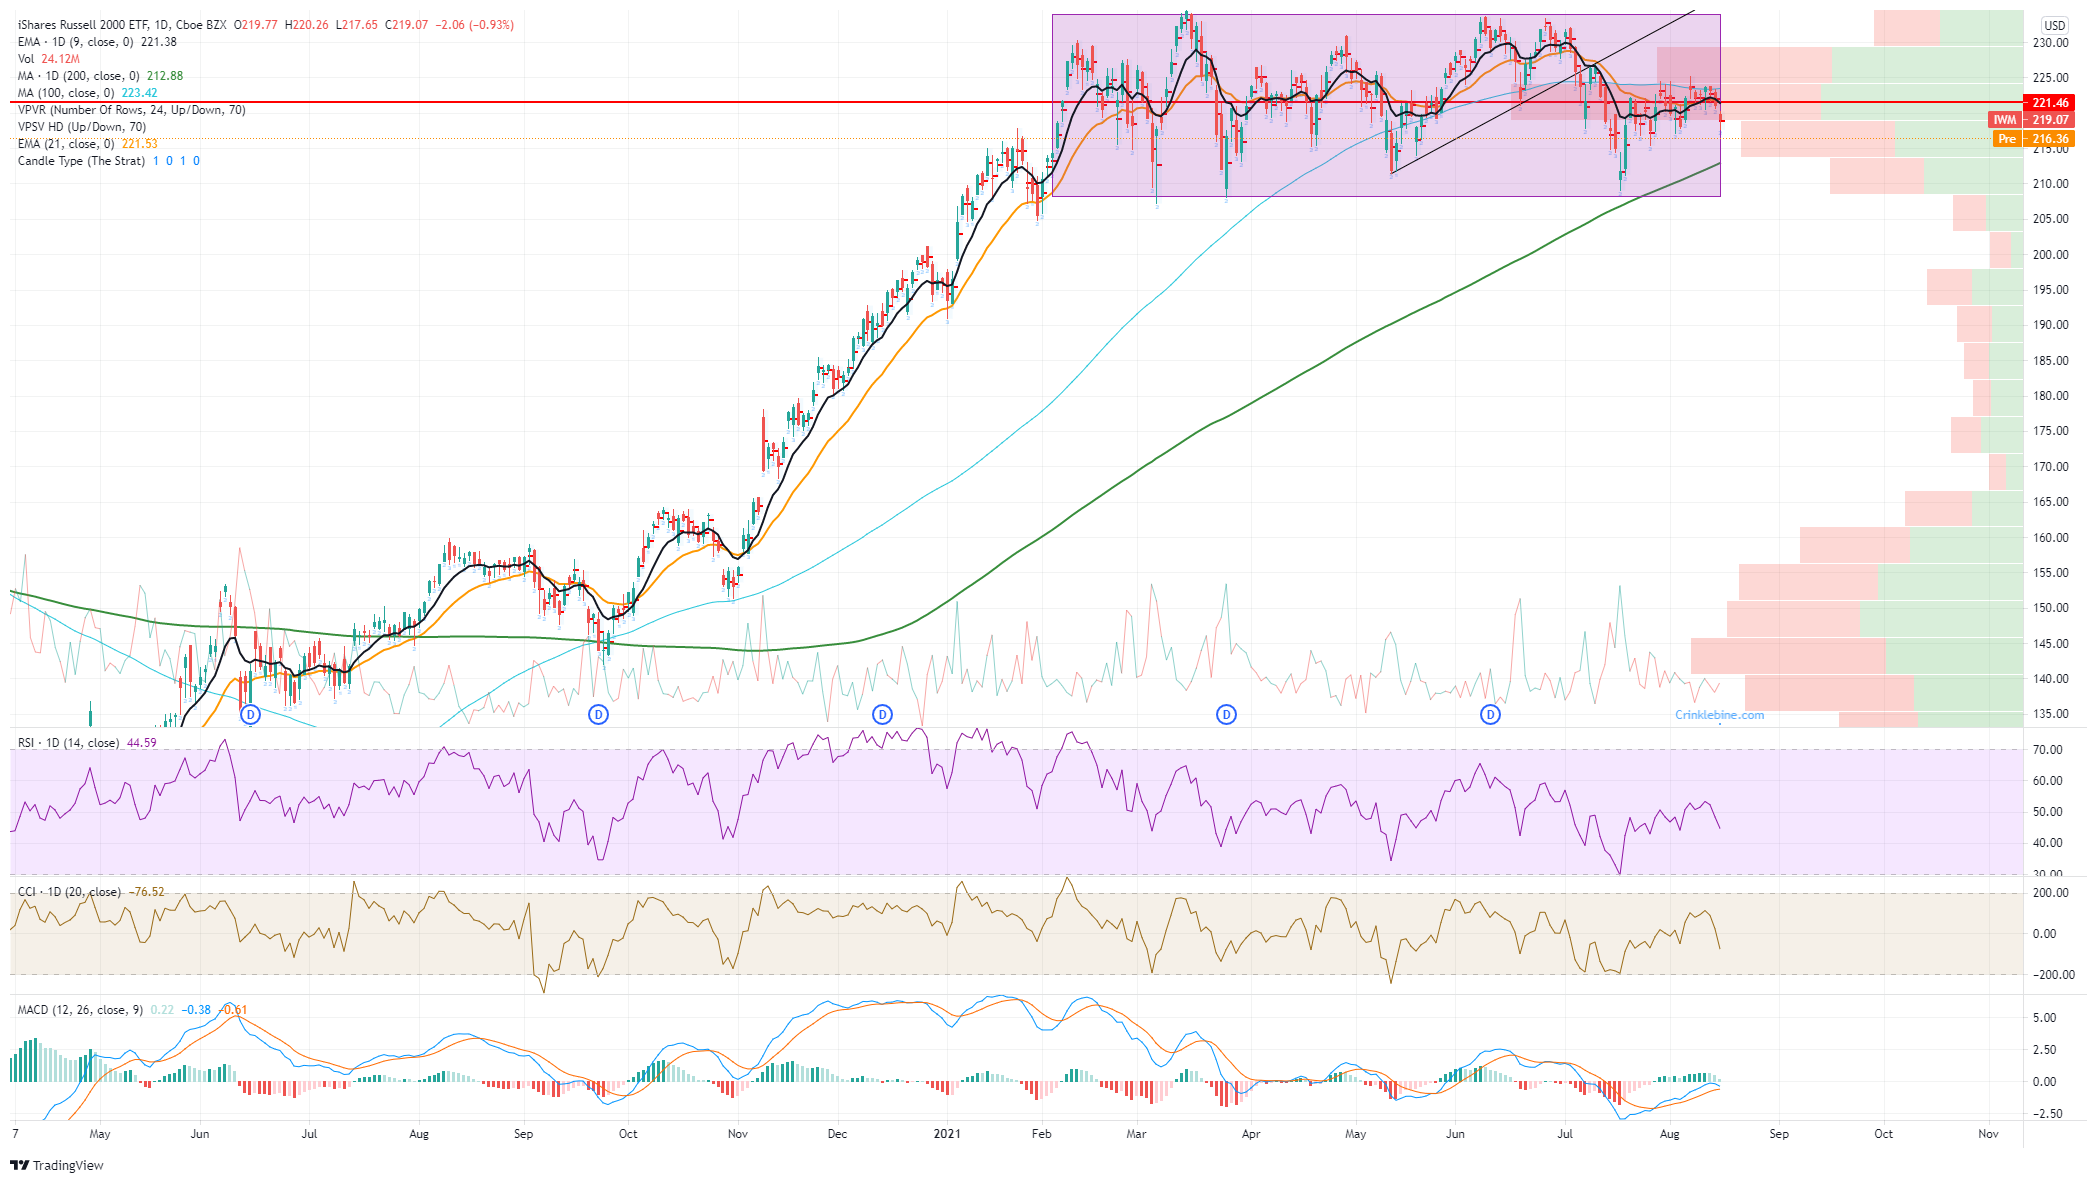
The broader Russell 2000 (IWM) Index just cannot catch a bid, falling 0.93% on Monday and remaining rangebound for most of 2021.
Like this article? Help us with some feedback by answering this survey:
Premium
You have reached your limit of 3 free articles for this month.
Start your subscription and get access to all our original articles.
Author

Ivan Brian
FXStreet
Ivan Brian started his career with AIB Bank in corporate finance and then worked for seven years at Baxter. He started as a macro analyst before becoming Head of Research and then CFO.


