|

SPDR Consumer Discretionary ETF ($XLY) Elliott Wave analysis: The rally and what’s next

In today’s article, we’ll examine the recent performance of the SPDR Consumer Discretionary ETF ($XLY) through the lens of Elliott Wave Theory. We’ll review how the rally from the October 23, 2024, low unfolded as a 5-wave impulse and discuss our forecast for the next move. Let’s dive into the structure and expectations for this ETF.

5 Wave Impulse Structure + ABC correction.

$XLY 1H Elliott Wave Chart 10.31.2024:
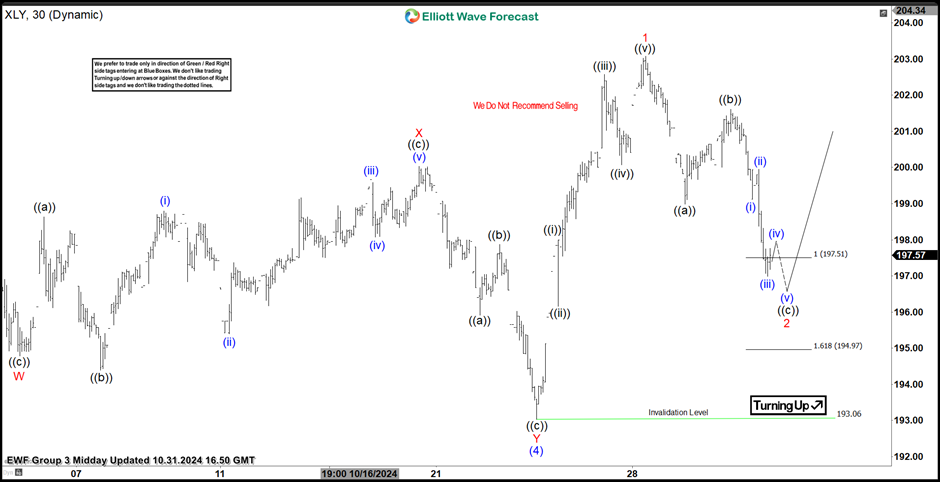
In the 1-hour Elliott Wave count from October 31, 2024, we see that $XLY completed a 5-wave impulsive cycle beginning on October 23, 2024, and ending on October 28, 2024, at the red 1. As expected, this initial wave prompted a pullback. We anticipated this pullback to unfold in 3 swings, likely finding buyers in the equal legs area between $197.51 and $194.97.

This setup aligns with a typical Elliott Wave correction pattern (ABC), where the market pauses briefly before resuming the main trend.

$XLY 1H Elliott Wave Chart 10.15.2024:
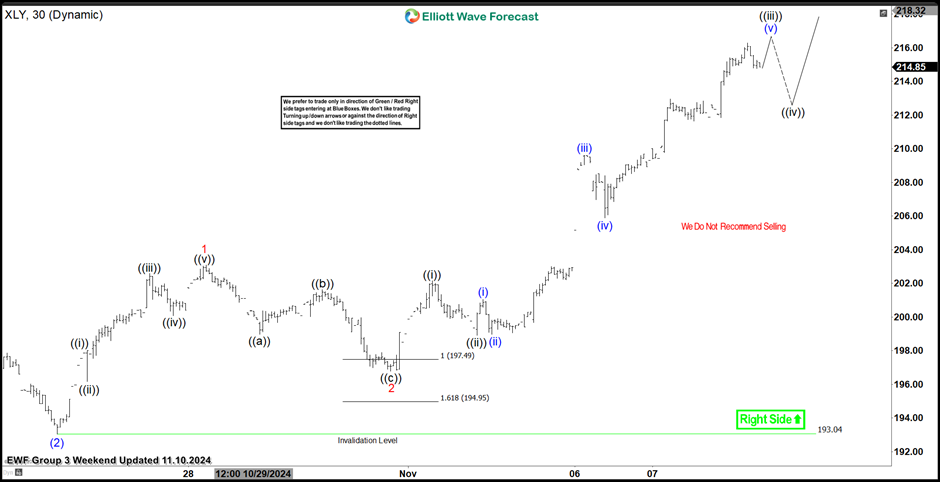
The most recent update, from November 10, 2024, shows that $XLY reacted as predicted. After the decline from the red 1 peak, the ETF found support in the equal legs area, leading to a renewed rally. As a result, traders could adjust to go risk-free, which confirmed that the bullish trend remains intact.

What’s next for $XLY?

With the current rally breaking into new all-time highs, $XLY appears well-supported. Based on the Elliott Wave structure, we expect the ETF to continue its upward trajectory, targeting the $235–$278 range before another potential pullback. Therefore, it is essential to keep monitoring this zone as we approach it.

Conclusion

In conclusion, our Elliott Wave analysis of the SPDR Consumer Discretionary ETF ($XLY) suggests that it could continue its bullish run, with significant upside potential in the short term. Therefore, traders should monitor the $235–$278 zone as the next target, keeping an eye out for any corrective pullbacks. By using Elliott Wave Theory, we can identify potential buying areas and enhance risk management in volatile markets.

Author

Elliott Wave Forecast Team

Elliott Wave Forecast Team

ElliottWave-Forecast.com

More from Elliott Wave Forecast Team
Share:

Editor's Picks

GBP/USD keeps range around 1.3600 amid a pause in USD sell-off

GBP/USD holds its retreat from its highest level since May 11, ranging around the 1.3600 mark in the European session on Thursday. US Dollar sellers take a breather as markets assess whether the US Treasury buyback will be a game-changer. Attention now remains on US data and Middle East headlines for further trading impetus.

EUR/USD consolidates below 1.1700 as USD stabilizes

EUR/USD enters a bullish consolidation phase below 1.1700 in European trading on Thursday after touching its highest level since late May. Bulls now await a move beyond the 1.1700 mark before placing fresh bets, as the US Dollar stabilizes following the US Treasury's bond buyback plan-led slump. US Jobless Claims data are next in focus amid lingering Iran risks.

Gold sticks to losses below $4,500 as USD firms on hawkish FOMC minutes and Iran risks

Gold sticks to modest intraday losses through the Asian session and currently trades below the $4,500 mark, though it remains close to the highest level since early June, set earlier this Thursday. Against the backdrop of geopolitical uncertainties, the US Dollar stabilizes after the previous day’s slump to a three-month low amid hawkish FOMC Minutes. This prompts bulls to take some profits off the table and weighs on the bullion, though retreating US bond yields limit further downside.

Top Altcoins Price Forecast: Ripple rallies above $1, Solana eyes $85, Cardano eases gains

Top altcoins, such as Ripple, Solana, and Cardano, are holding steady on Thursday after a bullish rebound as the broader crypto market rebounds on US Treasury bond buybacks. The technical outlook for XRP and SOL suggests further upside, while ADA risks losing the recent gains. Ripple trades around $1.0951 following a 10% surge the previous day.

The bond coup
Yesterday was marked by a coup from the US Treasury, which suddenly announced that it will ‘at least double’ the maximum size of its buyback operations for longer-term debt, hoping to ease pressure on long-term yields and borrowing costs. Phoah! The markets reacted heavily to the news. The US 10-year yield fell sharply, while the 30-year yield dropped from its highest levels since 2007.
$20 billion offered, $2 billion taken: Why Treasury doubled its buyback cap

The US Treasury moved off its own calendar on Wednesday, and that is the part worth sitting with. At 12:32 GMT, the department said it would at least double the size of liquidity support buyback operations in the 10-year to 20-year and 20-year to 30-year sectors, lifting the maximum from $2 billion per operation to at least $4 billion, effective September 9 and running to November 4.