S&P 500 balancing on the edge

Friday brings us the SP500 on an absolutely crucial support and what will happen from here will depend on trading over the next week or even a month.
The SP500 is currently testing the mid-term up trendline, the one supporting the most recent upswing. In addition to that, the price is forming a Head and Shoulders pattern (blue) and to be honest with you, the neckline was broken just now (red). That breakout, in theory, activates a sell signal but of course selling just above the up trendline is maybe not the wisest idea.
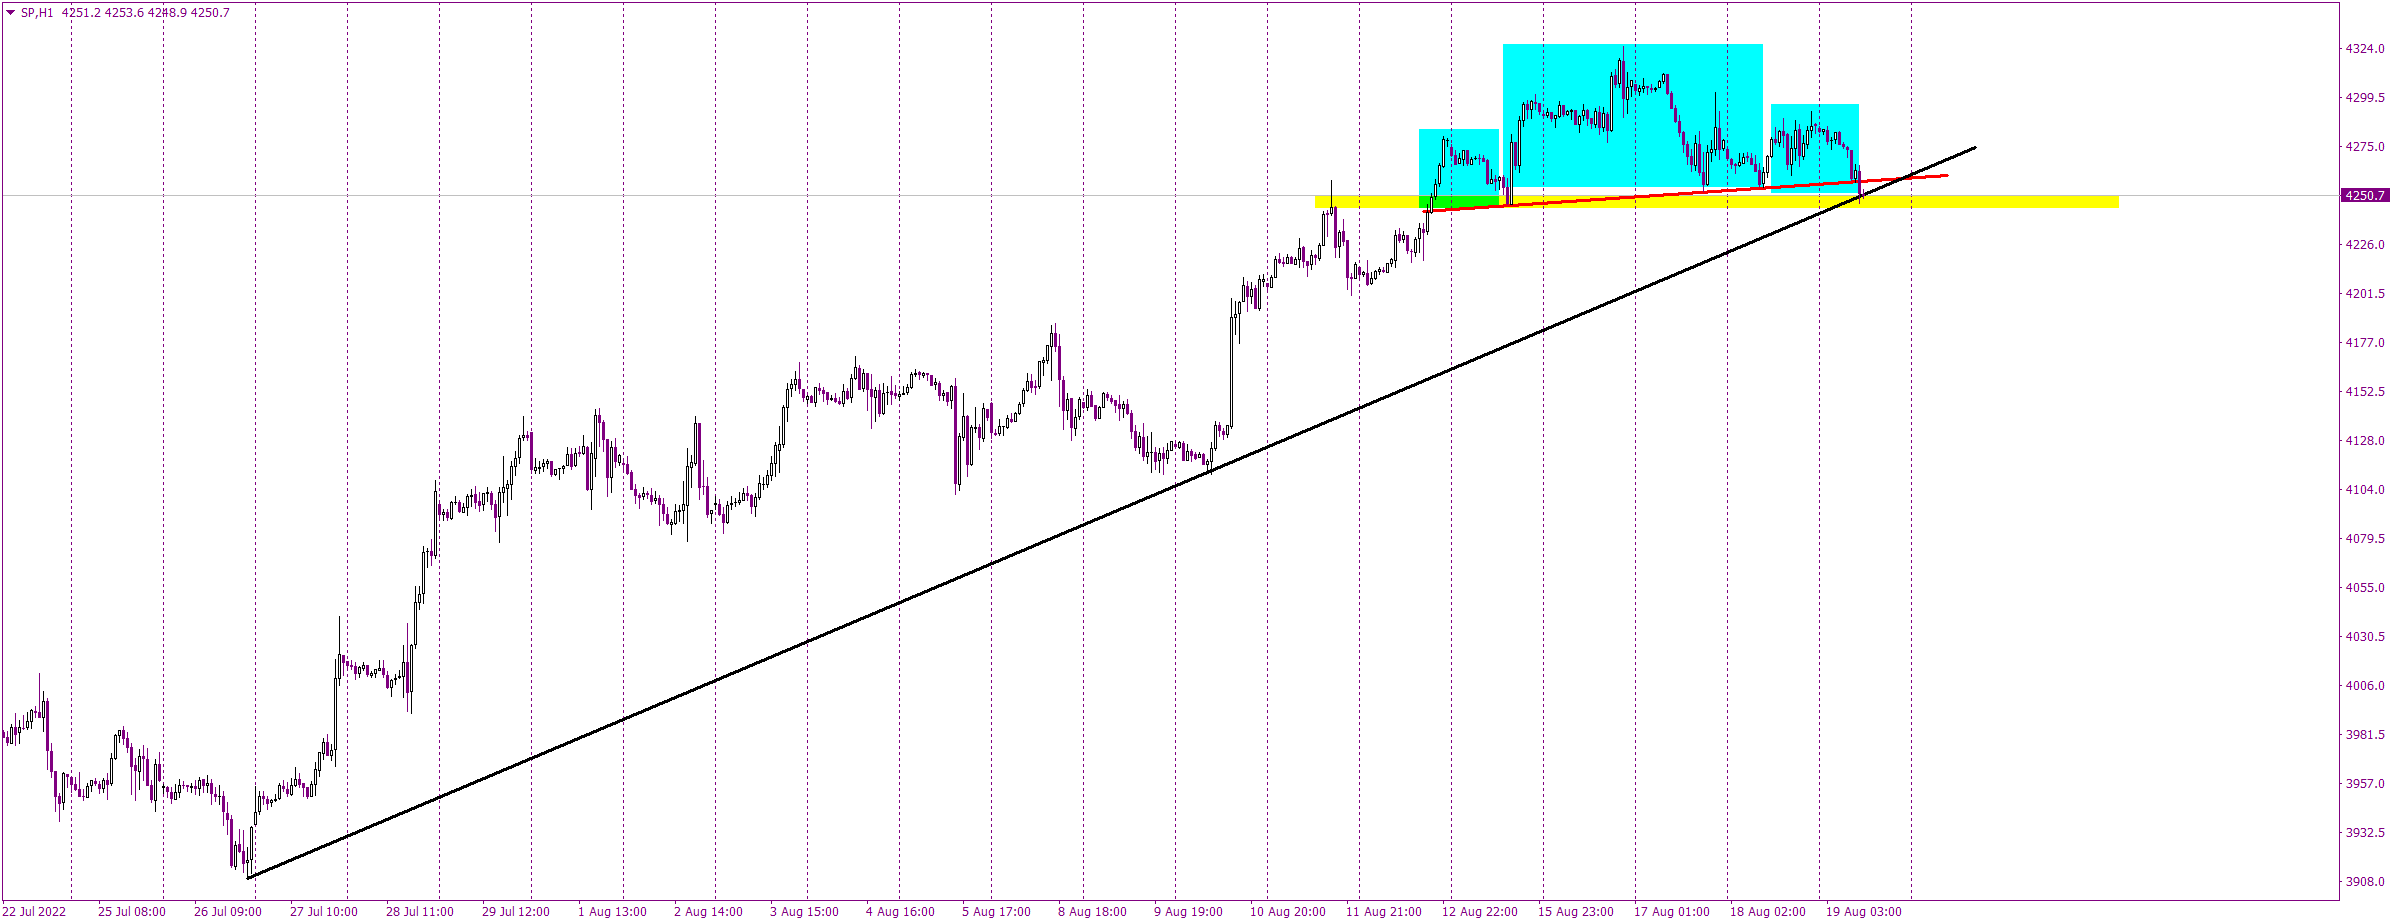
What we’re missing for the full sell signal is the price closing a day below the black up trendline and the horizontal support on the 4245 points (yellow). So far, the bearish pressure is clearly visible and buyers may have a problem defending it. The end of the week will definitely be interesting so let’s see what the price will eventually create here, a bullish bounce or a bearish breakout.
Author

Tomasz Wisniewski
Axiory Global Ltd.
Tomasz was born in Warsaw, Poland on 25th October, 1985.


