|

S&P 500: Technical outlook and review

S&P 500 chalks up largest one-month gain since mid-2022

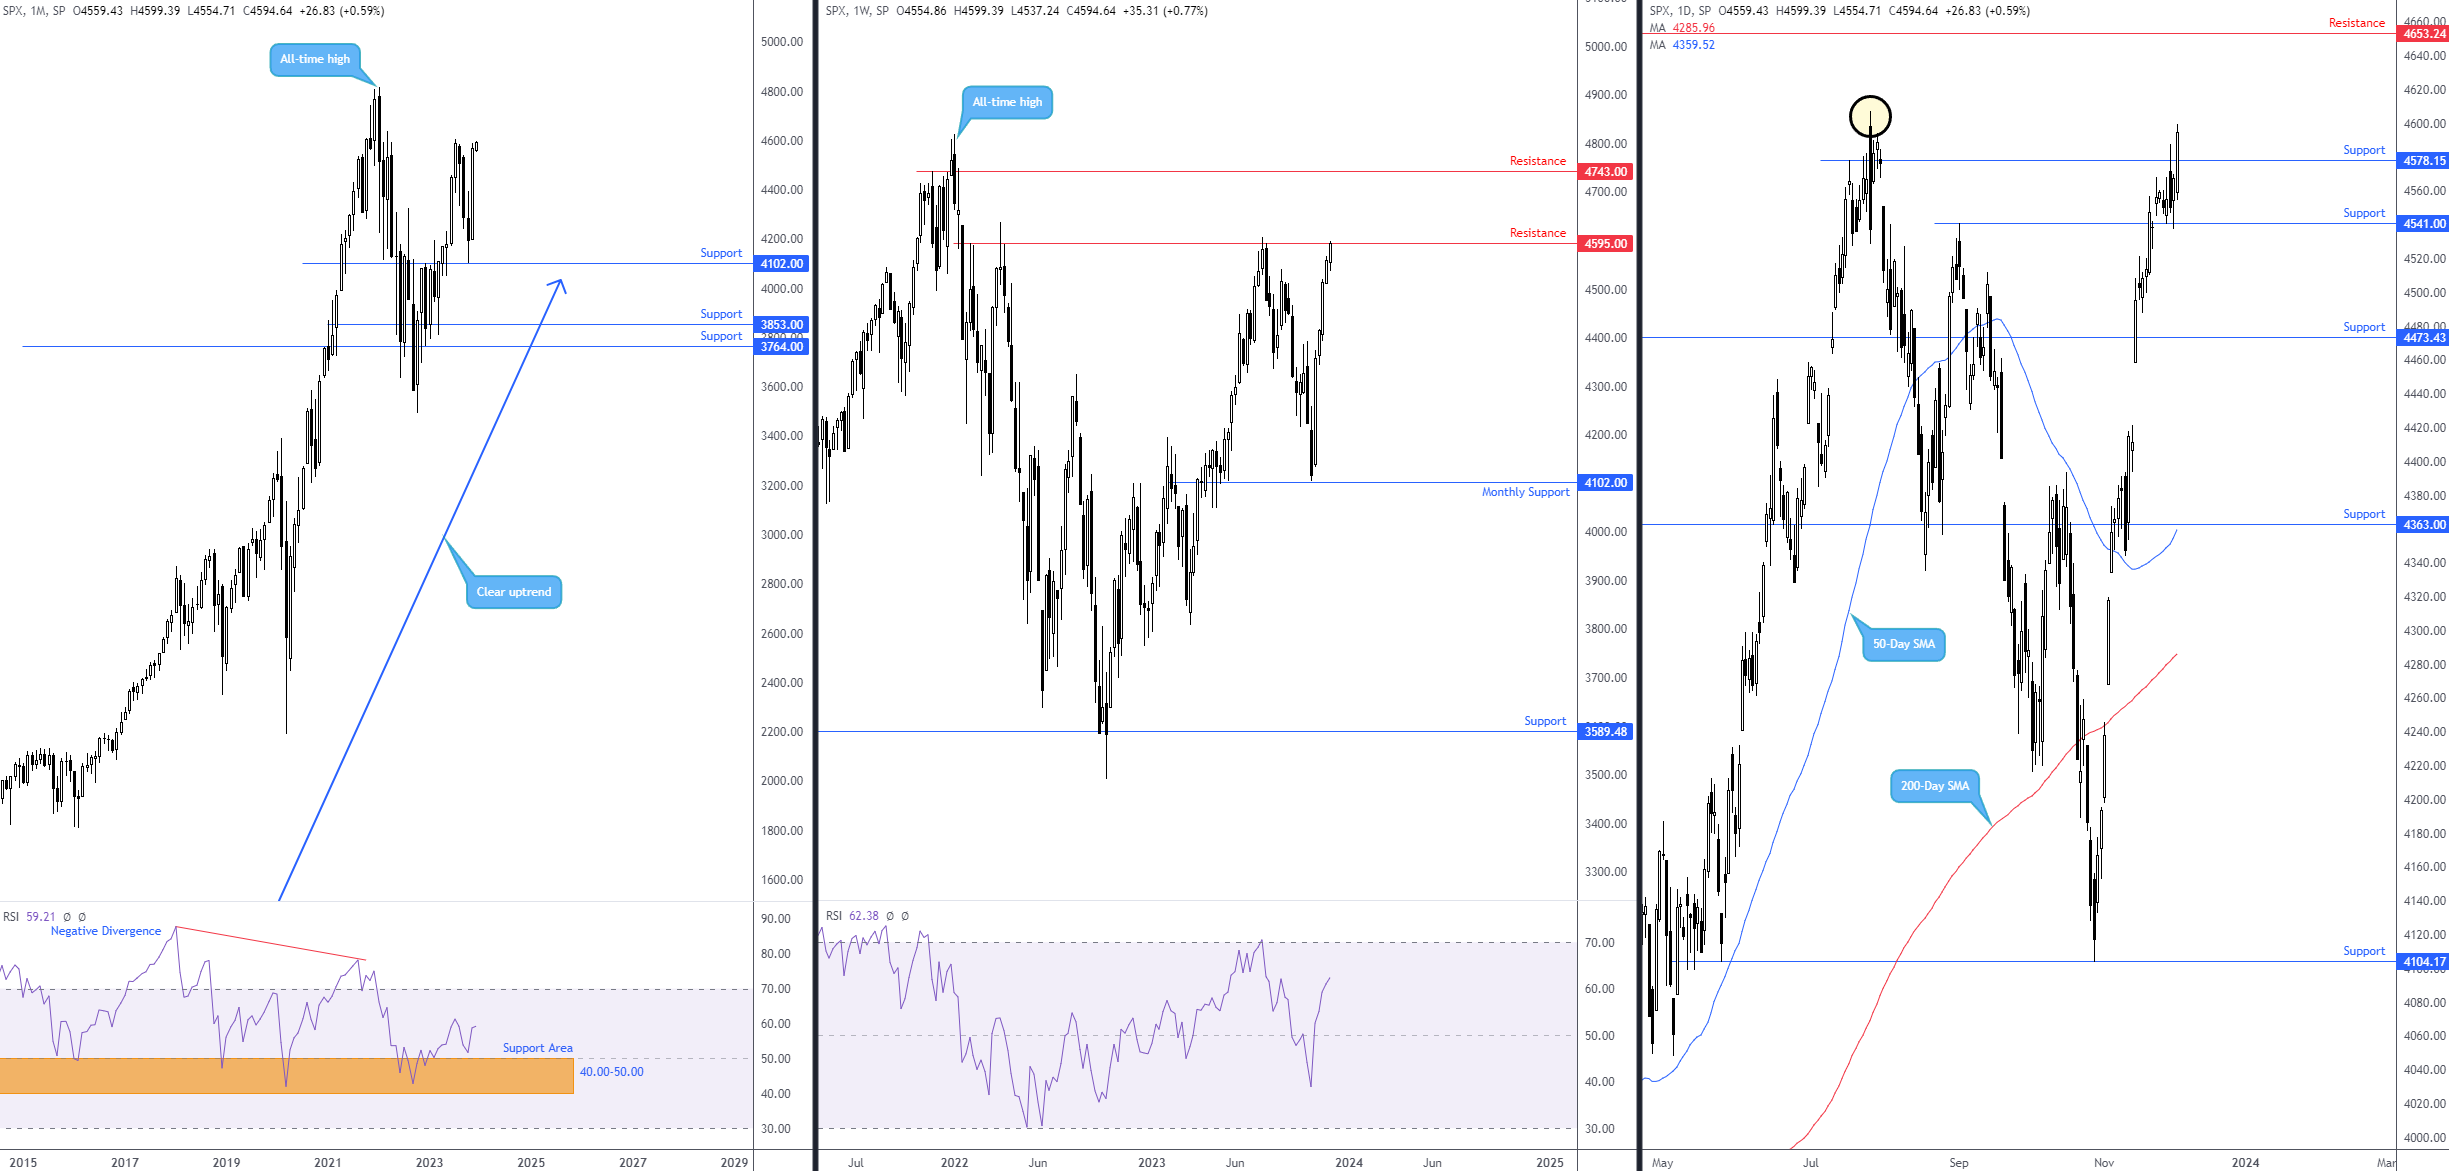
November finished higher by nearly 9.0%; it was a cracking month for the S&P 500, chalking up its largest one-month gain since July 2022 and closing on the doorstep of the 4,607 top printed in July. You will note that from the monthly timeframe, we can see that the Index is entrenched within a longer-term uptrend, and a break beyond 4,607 could pave the way to the all-time high of 4,818.

According to the weekly chart, the week finished shaking hands with a resistance level of 4,595, a base the Research Team have banged the drum for over the past couple of weeks. If we clear offers around this level this week, space to explore higher terrain throws resistance at 4,743 into the mix as potential resistance in the coming weeks, sheltered just south of 4,818.

The Relative Strength Index (RSI) on both the monthly and weekly charts indicate positive momentum (> 50.00) and exhibit room to push higher until reaching overbought conditions.

Moving across to the daily timeframe, price action helped reaffirm the bullish presence by rupturing resistance at 4,578 last week (now a marked support level). This followed a retest of support at 4,541, as was noted as a possibility in last week’s week-ahead post. Subsequent buying exposes the 4,607 top (circled) mentioned above on the monthly timeframe, followed by daily resistance at 4,653.

Going forward

While there is certainly a ceiling of resistance for buyers to contend with this week: weekly resistance at 4,595 and the July peak at 4,607, the strength of buyers is hard to overlook. As a result, any retest seen at daily support from 4,578 this week could bolster dip buying. Additionally, a breakout beyond 4,607/4.595 resistance may encourage further upside towards daily resistance at 4,653.

Charts: TradingView

Author

Aaron Hill

Aaron Hill

FP Markets

After completing his Bachelor’s degree in English and Creative Writing in the UK, and subsequently spending a handful of years teaching English as a foreign language teacher around Asia, Aaron was introduced to financial trading,

More from Aaron Hill
Share:

Editor's Picks

AUD/USD stays bid above 0.7100 on Australian trade data, Mideast optimism

AUD/USD clings to minor recovery gains above 0.7100 in the Asian session on Thursday as a new Israel-Lebanon ceasefire keeps a lid on the safe-haven US Dollar. Meanwhile, strong AustralianTrade Balane data also help the Aussie pair sustain the bounce from weekly lows.

USD/JPY hovers near the 160.00 intervention threshold on Mideast tensions

USD/JPY struggles to find acceptance above 160.00 and retreats from a one-month high in the Asian session on Thursday amid fears that authorities will step in again to prop up the Japanese Yen. Furthermore, a new Israel-Lebanon ceasefire caps the US Dollar and supports the currency pair. However, renewed US-Iran tensions keep the downside limited in the Greenback and the pair.

Gold rebounds from one-week low as Israel-Lebanon truce pressures safe-haven USD

Gold gains some positive traction on Thursday and climbs to the $4,475 area during the Asian session, reversing a major part of the previous day's slide to a one-week low. The Israel-Lebanon truce prompts some profit-taking around the US Dollar and supports the commodity. 


Ethereum: Long-term holders' capitulation drives ETH below $1,800

Ethereum has fallen below $1,800 on Wednesday, the first time since May 2025 following accelerated spot selling pressure and distributions from long-term holders. The Age Consumed metric, which tracks the movement of previously idle tokens or long-term holders' coins, spiked over the past two days as prices declined, indicating increased selling activity among this cohort.

Kevin Warsh takes the Fed helm: What it means for the US Dollar
The Federal Reserve moves away from the highly predictable "forward guidance" model of the Jerome Powell era to a new “Kevin Warsh environment”, characterized by less communication, more policy surprises, and an increased focus on the Fed's complex balance sheet.
Recession on paper: What really moves the Canadian Loonie now?

Statistics Canada handed the headline writers a gift and the analysts a headache. Real GDP shrank 0.1% on an annualized basis in the first quarter, and with the fourth quarter of 2025 revised down to a 1.0% contraction, that is two negative quarters in a row, the textbook definition of a technical recession and Canada's first since the pandemic.