S&P 500 reaches 6,000 for first time since February on NFP print
- S&P 500 reaches 6,000 for the first time in 15 weeks.
- May NFP shows job gains at 139K, above the 130K consensus.
- AVGO, DOCU stocks shed weight on earnings guidance.
- Musk and Trump patch up their differences from Thursday's war of words.


The S&P 500 has dashed up above 6,000 on Friday morning after the May Nonfarm Payrolls (NFP) print came in above consensus, dispelling worries that Wednesday's ADP Employment Change disaster would carry over into the more trust NFP data. This was the first time since February 26 that the S&P 500 reached that level.
Additionally, Tesla (TSLA) CEO Elon Musk sought to patch up his relationship with US President Donald Trump after Thursday's meltdown in which the former Trump administration figure called for the impeachment of the president on social media. Musk said he would not break off SpaceX's relationship with NASA, the US government's space agency.
All three major US equity indices have advanced over 1% on Friday, and investors look to end the week with a bang.
S&P 500 news
For the first time in 15 weeks, the S&P 500 has reached the 6,000 level, a point first reached on November 4 last year. The interim saw a fierce pullback to the 4,800s, but the back half of April and May have witnessed strong rallies to recover the lost ground.
The US Bureau of Labor Statistics has also greatly boosted bullish fervor with its 139K NFP print for May. That figure was better than the 130K consensus figure from economists. But it was also below April's data, which saw a major revision from 177K to 147K.
The Unemployment Rate remained at 4.2% in May, but the Labor Force Participation Rate fell from 62.6% to 62.4%. Average Hourly Earnings also rose above consensus on both a monthly and annual basis.
Both Broadcom (AVGO) and DocuSign (DOCU) face-planted following earnings, however, traveling in the opposite direction of Friday's market. For both stocks, the companies beat the reported quarter's consensus top and bottom line figures, but guidance proved to be a bridge too far for shareholders.
Broadcom stock sank over 2.5% early Friday, while DocuSign shares have lost a staggering 19%. Tesla rebounded over 4%.
S&P 500 chart
There has been a lot of chatter and concern about the Trump administration's tariffs filtering back into company earnings and reduced consumer spending in the back half of the year. But for now, the market sees decent enough labor data and the expectation that Trump will secure new trade deals in the near future, that stock prices have room for upward movement.
The chart shows us that the S&P 500's two-month rally isn't ready to peter out just yet. Expect bulls to at the very least push the index back into the resistance zone ranging from 6,100 to 6,150. This area held up from last December through this February.
The Relative Strength Index (RSI) at 65 is not yet overbought and has room for June to offer further gains.
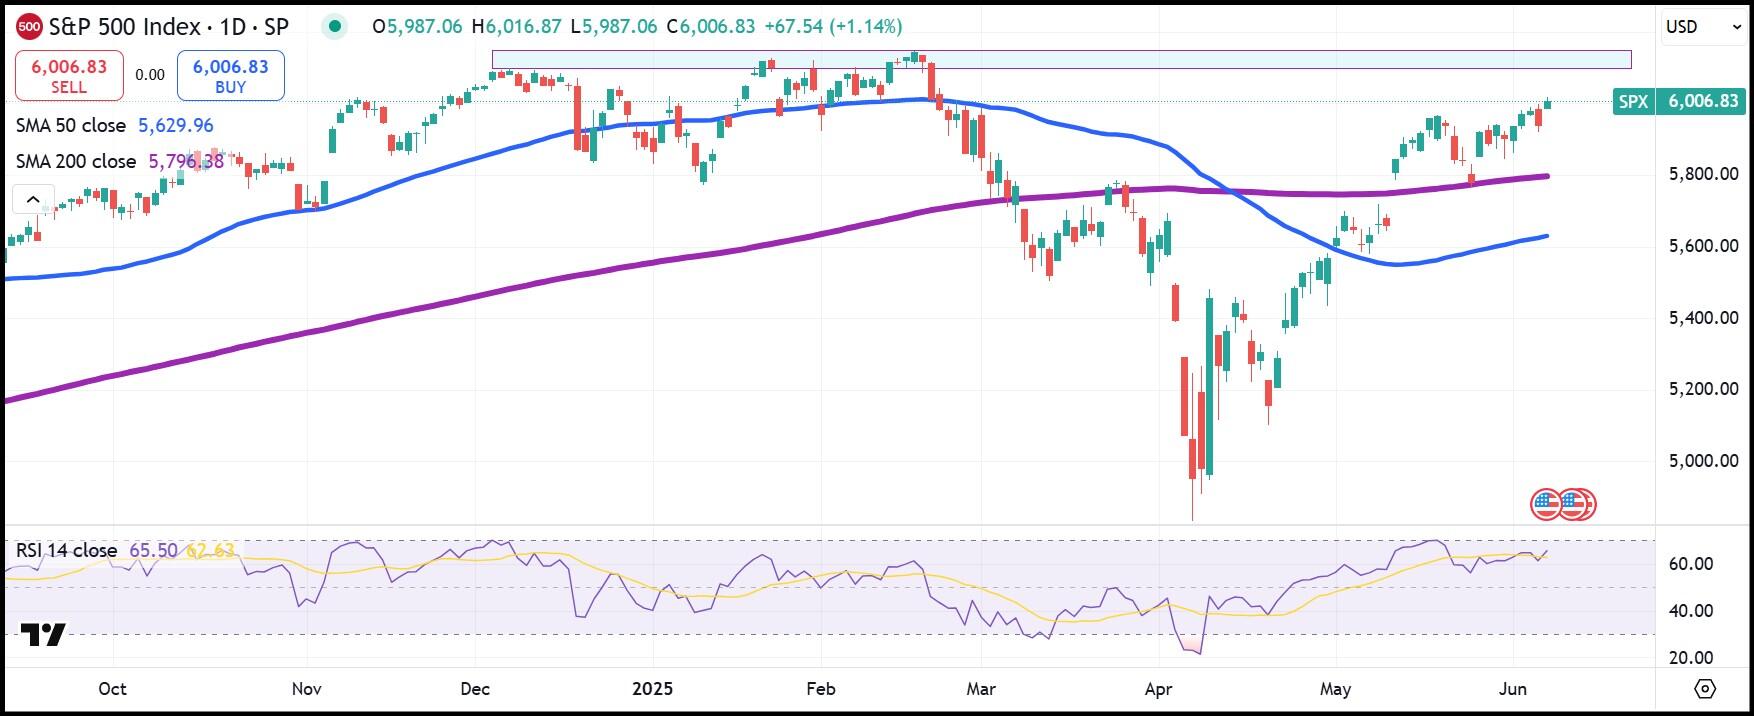
S&P 500 index daily chart
Author
Clay Webster
FXStreet
Clay Webster grew up in the US outside Buffalo, New York and Lancaster, Pennsylvania. He began investing after college following the 2008 financial crisis.

















