|

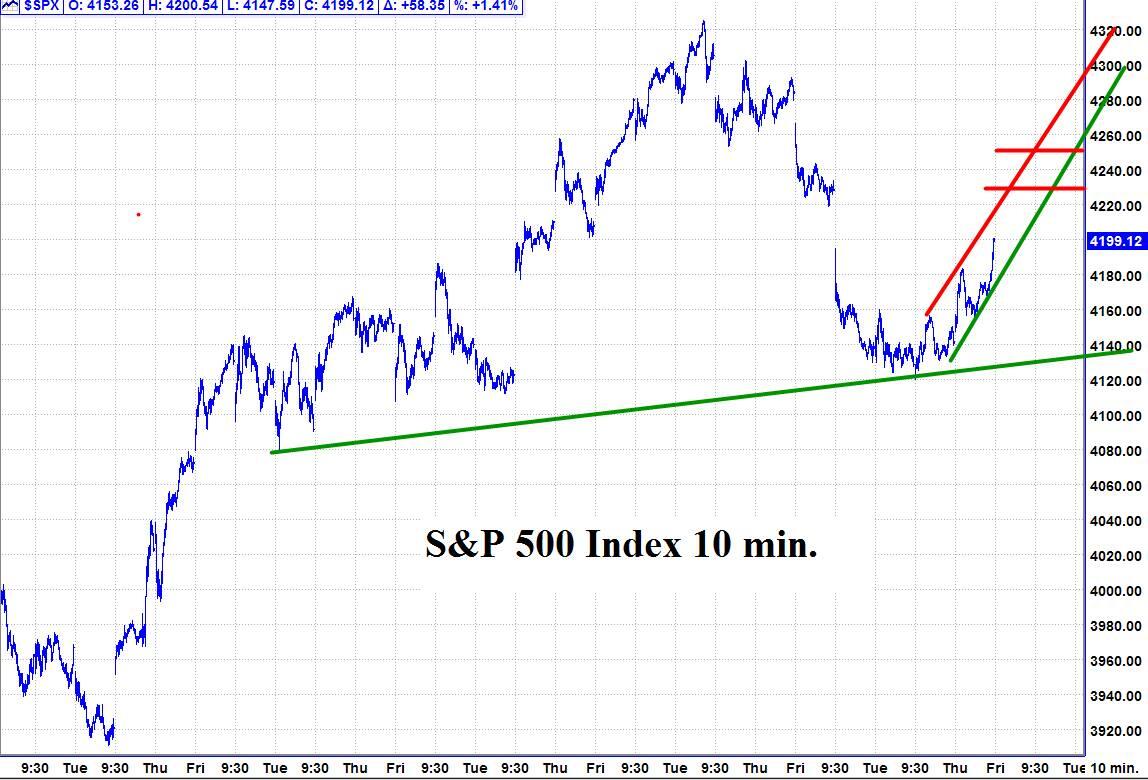
S&P 500 rallied to our first target area of 4203

Recap 8/25 - The S&P opened with a 12 handle gap up, rallied another 4 handles and then pulled back 9 handles into a 9:35 AM low of the day. From that low, the S&P rallied 36 handles into a 10:46 AM high.  From that high, the S&P declined 29 handles into a 12:50 PM low.  From that low, the S&P rallied 45 handles into the close.   

Chart

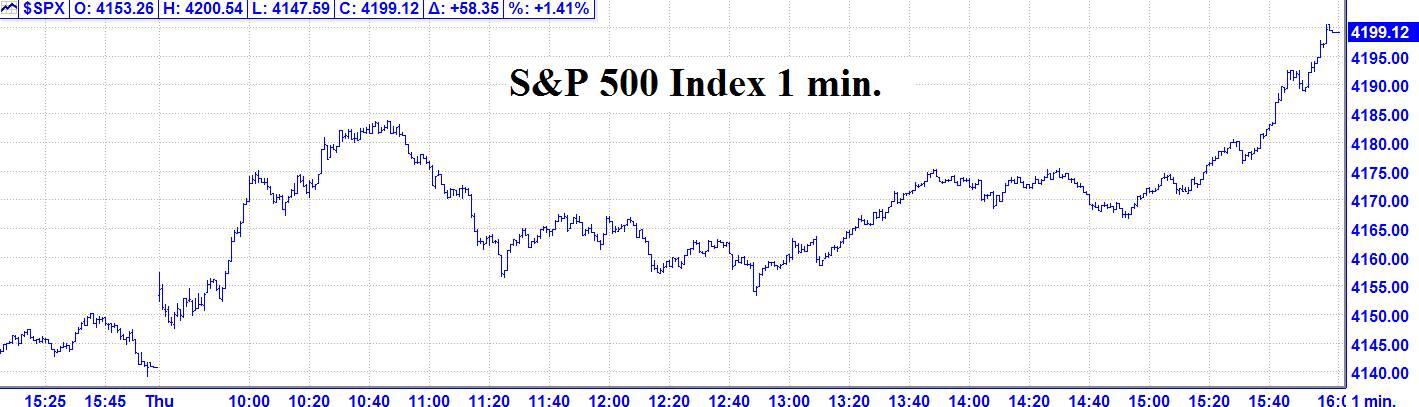
8/25 – The major indices had a big up day to finish with the following closes: DJIA + 322.55; S&P 500 + 58.35;  and the Nasdaq Comp. + 207.74.              

Looking Ahead –  The S&P followed thru on the upside on Thursday, which was our preferred scenario. Technically, the S&P rallied to our first target area of 4203, which is a Fibonacci /.382 retracement of the last decline.  The next target, if the rally continues is 4229, and then 4254. The ideal scenario is for the rally to continue into the weekend, when we have our next major change in trend window.  This would indicate a probable high for Monday.  However, if there is a substantial decline on Friday, then we would expect a low on Monday. Please see details below.

The Now Index is in the NEUTRAL ZONE.   

Coming events  

(Stocks potentially respond to all events).                  

4. A. 8/26 AC – New Moon in Virgo.  Major change in trend Financials, Grains, Precious Metals, Soybeans.

    B. 8/26 AC – Saturn 150 US Mars.  Moderate change in trend US Stocks, T-Bonds, US Dollar.     

    C. 8/26 AC – Mercury Maximum Elongation East.  Major change in trend Corn, Oats, Soybeans, Wheat.                 

    D. 8/26 AC - Moon’s North Node Contra-Parallel US MC.  Major change in trend US Stocks, T-Bonds, US Dollar. 

Stock market key dates

Market math

8/28 = 8,192 music days > 3/24/2000 major high.

Astro –  8/26 AC.

Please see below the S&P 500  10 minute chart.    

Support  - 4180, 4120  Resistance –  4203, 4229, 4254.

Chart

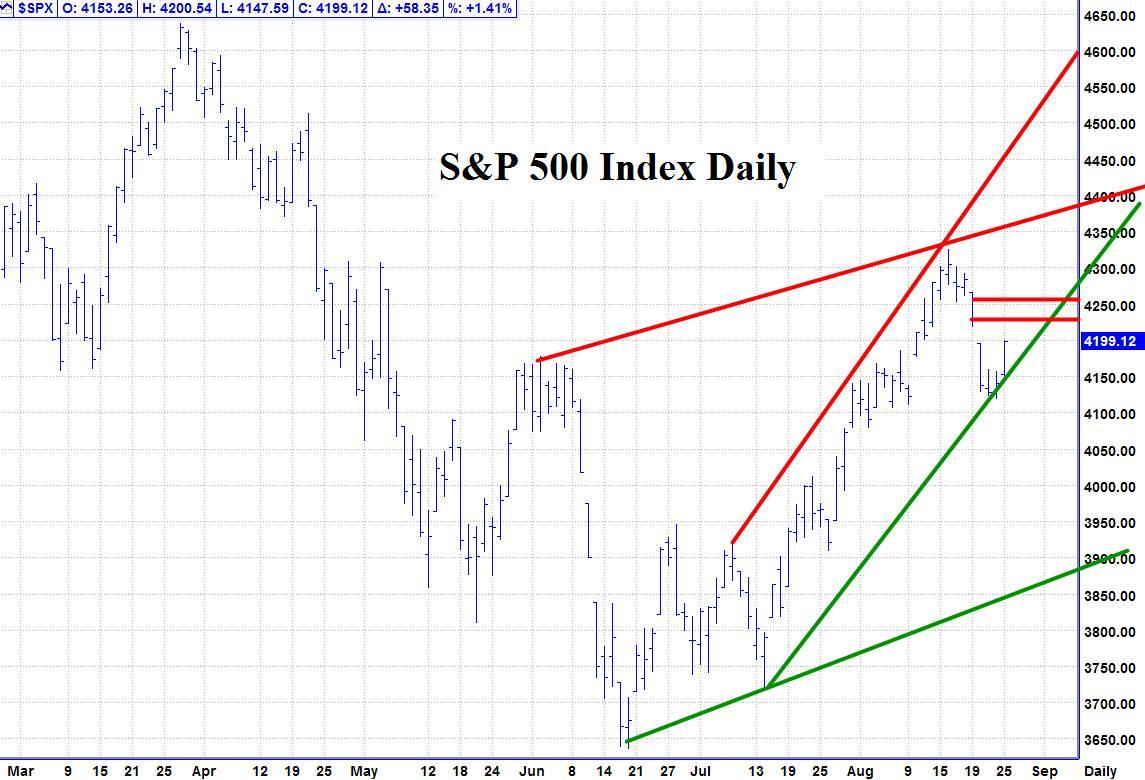
Please see below the S&P 500 Daily chart.                                         

Support  - 4180, 4120  Resistance –  4203, 4229, 4254.

Chart

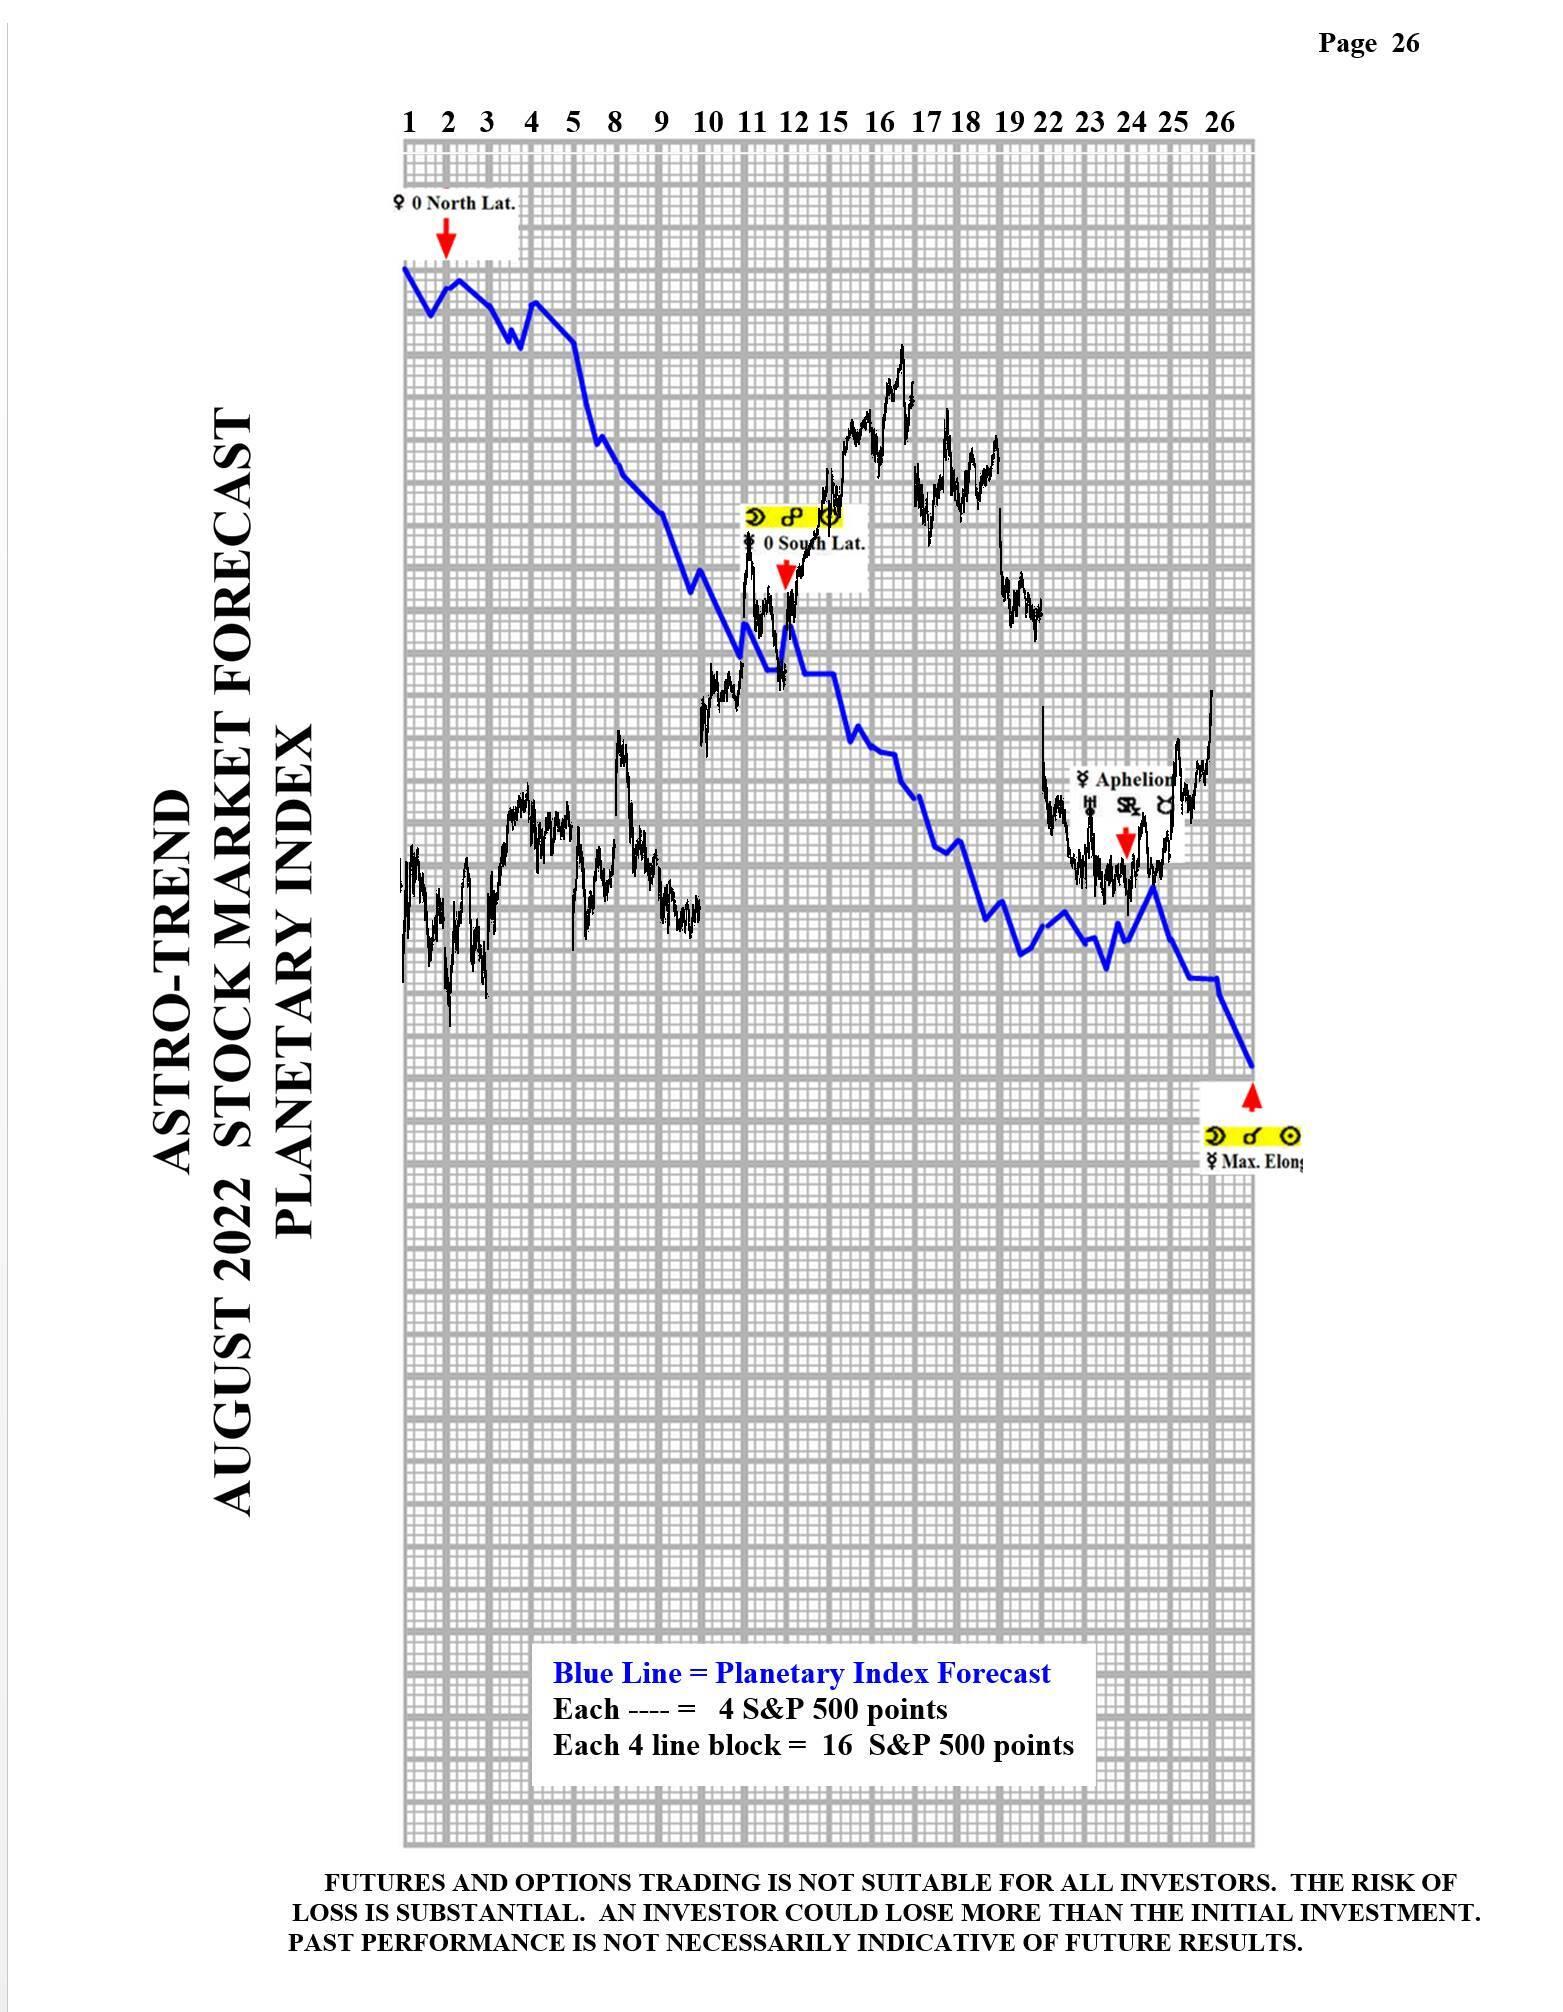
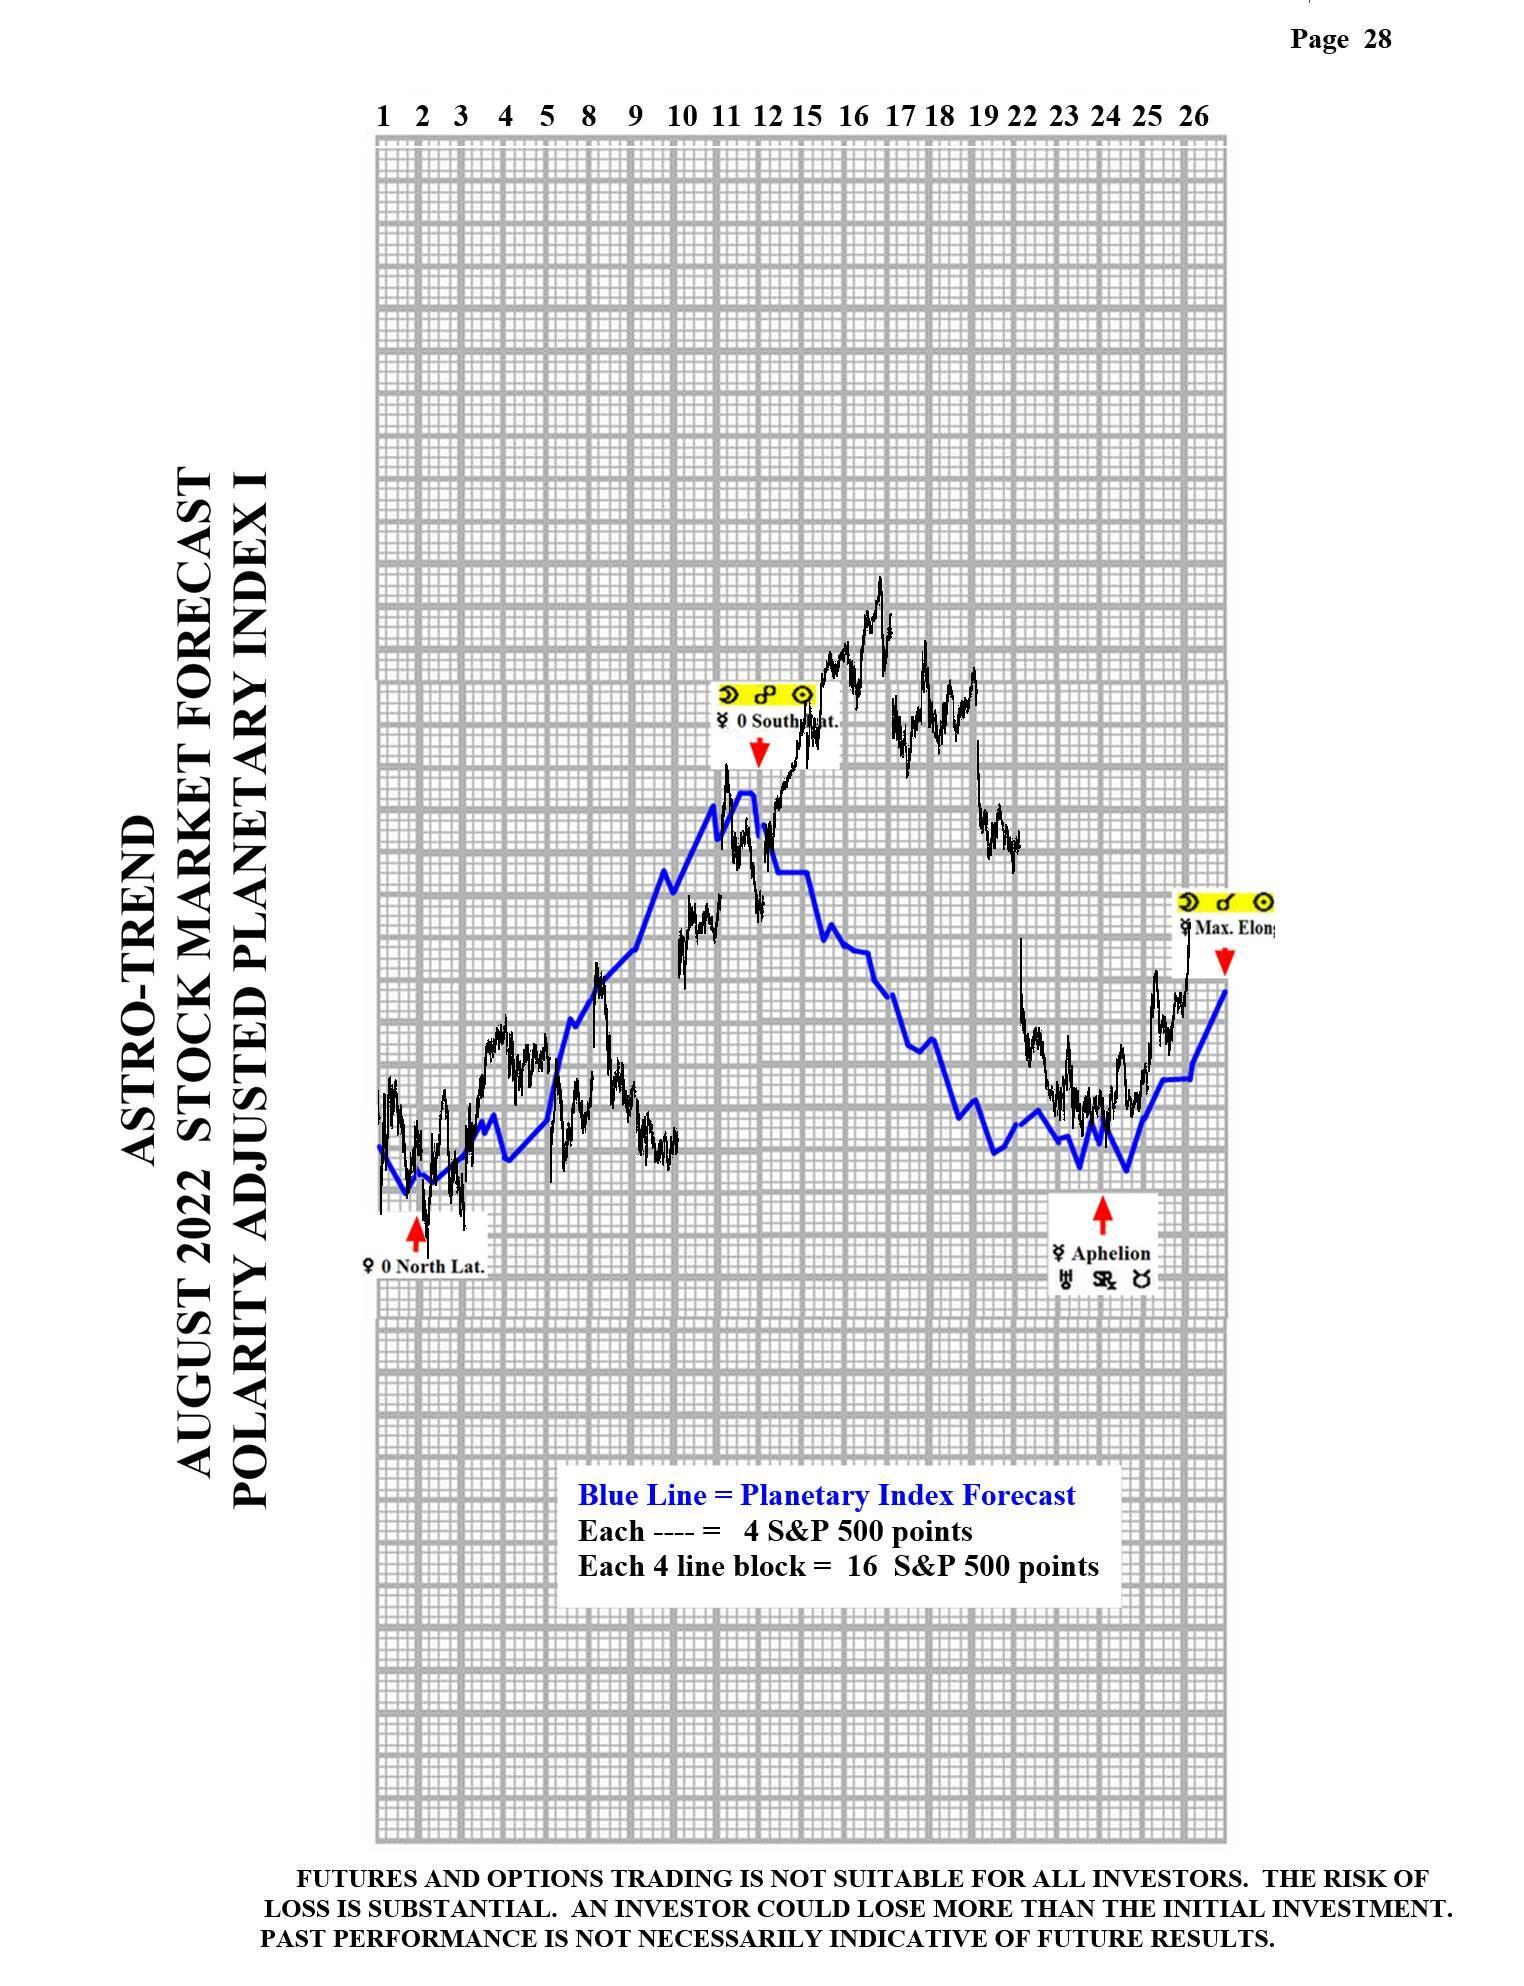
Please see below the August Planetary Index chart with S&P 500 10 minute bars for results. As of 8/23, I am dropping Planetary Index pages 27 and 29.

Chart
Chart

Author

Norm Winski

Norm Winski

Independent Analyst

www.astro-trend.com

More from Norm Winski
Share:

Markets move fast. We move first.

Orange Juice Newsletter brings you expert driven insights - not headlines. Every day on your inbox.

By subscribing you agree to our Terms and conditions.

Editor's Picks

EUR/USD drops to daily lows near 1.1630

EUR/USD now loses some traction and slips back to the area of daily lows around 1.1630 on the back of a mild bounce in the US Dollar. Fresh US data, including the September PCE inflation numbers and the latest read on December consumer sentiment, didn’t really move the needle, so the pair is still on course to finish the week with a respectable gain.

GBP/USD trims gains, recedes toward 1.3320

GBP/USD is struggling to keep its daily advance, coming under fresh pressure and retreating to the 1.3320 zone following a mild bullish attempt in the Greenback. Even though US consumer sentiment surprised to the upside, the US Dollar isn’t getting much love, as traders are far more interested in what the Fed will say next week.

Gold makes a U-turn, back to $4,200

Gold is now losing the grip and receding to the key $4,200 region per troy ounce following some signs of life in the Greenback and a marked bounce in US Treasury yields across the board. The positive outlook for the precious metal, however, remains underpinned by steady bets for extra easing by the Fed.

Crypto Today: Bitcoin, Ethereum, XRP pare gains despite increasing hopes of upcoming Fed rate cut

Bitcoin is steadying above $91,000 at the time of writing on Friday. Ethereum remains above $3,100, reflecting positive sentiment ahead of the Federal Reserve's (Fed) monetary policy meeting on December 10.

Week ahead – Rate cut or market shock? The Fed decides

Fed rate cut widely expected; dot plot and overall meeting rhetoric also matter. Risk appetite is supported by Fed rate cut expectations; cryptos show signs of life. RBA, BoC and SNB also meet; chances of surprises are relatively low.

Ripple faces persistent bear risks, shrugging off ETF inflows

Ripple is extending its decline for the second consecutive day, trading at $2.06 at the time of writing on Friday. Sentiment surrounding the cross-border remittance token continues to lag despite steady inflows into XRP spot ETFs.