S&P 500 Price Analysis: Key levels to watch in the week ahead – Confluence Detector

The S&P 500 Index closed the holiday-shortened week higher by over 3%, although off the three-week high of 3,165.81. The stocks surged on vaccine hopes and record US June Non-Farm Payrolls addition. Let’s take a look at the Technical Confluences Indicator to know how the index is positioned heading into a fresh week.
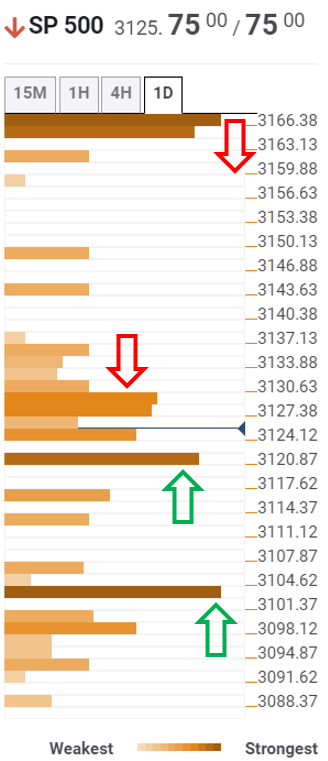
The tool shows that the S&P 500 closed the week above the key support at 3,120.87, where the Fibonacci 38.2% one-month and Bollinger Band (BB) 15-minutes Lower coincide.
The immediate resistance, therefore, lies around 3,129, a cluster of barriers are stacked up. That level is the confluence of the Fibonacci 38.2% one-day, Fibonacci 23.6% one-week and SMA 10 one-hour.
On clearance of the latter, the bulls will target the next strong resistance at 3,165, the intersection of the Fibonacci 23.6% one-month, the previous week high and Fibonacci 161.8% one-day.
If the bears manage to take out the aforesaid support at 3,120.87, the next cushion awaits at 3,115, which is the confluence of the previous day low and BB one-hour Lower.
The support at 3,103 will likely test the bears’ commitment on the south run, as the convergence of the Fibonacci38.2% one-week and SMA 1 one-day makes it a critical barrier.
Here is how it looks on the tool
Confluence Detector
The Confluence Detector finds exciting opportunities using Technical Confluences. The TC is a tool to locate and point out those price levels where there is a congestion of indicators, moving averages, Fibonacci levels, Pivot Points, etc. Knowing where these congestion points are located is very useful for the trader, and can be used as a basis for different strategies.
This tool assigns a certain amount of “weight” to each indicator, and this “weight” can influence adjacents price levels. These weightings mean that one price level without any indicator or moving average but under the influence of two “strongly weighted” levels accumulate more resistance than their neighbors. In these cases, the tool signals resistance in apparently empty areas.
Author

Dhwani Mehta
FXStreet
Residing in Mumbai (India), Dhwani is a Senior Analyst and Manager of the Asian session at FXStreet. She has over 10 years of experience in analyzing and covering the global financial markets, with specialization in Forex and commodities markets.