S&P 500 inches up amid mixed US inflation data: Is Wall Street pricing in a Fed rate peak?
- S&P 500 gains 0.12% to 4467.44, while Dow Jones drops 0.20%; Nasdaq 100 rises 0.29% amid mixed market sentiment.
- US CPI for August comes in at 3.7% YoY, exceeding forecasts, but core inflation drops to 4.3%, in line with expectations.
- CME FedWatch Tool suggests no rate hike in September; upcoming unemployment and retail sales data could influence the Fed’s stance.
US equities finished Wednesday’s sessions with gains, except for the Dow Jones Industrial Averages, printing its first loss in the last five days. A mixed report increased speculations the US Federal Reserve would not raise rates at the upcoming meeting while the Greenback advanced.
US equities were mixed as US CPI left the market uncertain about the US central bank’s next move
The S&P 500 stands at 4,467.44, gaining 0.12%, while the heavy-tech Nasdaq 100 finished in the green at 13,813.59, up 0.29%. The outlier was the Dow Jones Industrial Average, which dropped 0.20% and ended the session at 34,575.53
Sector-wise, the biggest winner was Utilities, followed by Consumer Discretionary and Communication Services, each gained 1.2%, 0.9% and 0.40%. On the flip side, Real Estate, Energy, and Industrials printed losses of 1.03%, 0.76% and 0.67%.
The US Department of Labor revealed that inflation data for August showed mixed results. The Consumer Price Index (CPI) came in at 3.7% year-on-year, which exceeded forecasts that had expected inflation to be at 3.6% and was also higher than July’s figure. However, core inflation, which excludes volatile items, dropped from 4.7% year-on-year in July to 4.3%, in line with analyst projections.
Despite the inflation data, the market did not anticipate additional tightening by the US Federal Reserve (Fed), as indicated by money market futures data. The CME FedWatch Tool still suggests that the Fed will likely maintain interest rates at 5.25% to 5.50% for the upcoming September meeting.
Although the Wall Street reaction suggests that traders are pricing in a peak to the Federal Funds Rates (FFR), there’s additional data that could shift market participants’ mood. For instance, if unemployment claims rise as expected and August’s Retail Sales report shows weaker figures compared to July, this could contribute to the argument for the Federal Reserve potentially considering the end of its tightening cycle.
US Treasury bond yields finished the session with the 10-year benchmark note rate at 4.254%, lost 0. 70%. The Greenback, shown by the US Dollar Index, ended positively, climbing 0.20%, at 104.76.
WTI rose by 0.10% daily in the commodity space underpinned by tight supplies after Saudi Arabia and Russia’s 1.3 million barrel crude oil cut.
S&P 500 Price Action – Daily Chart
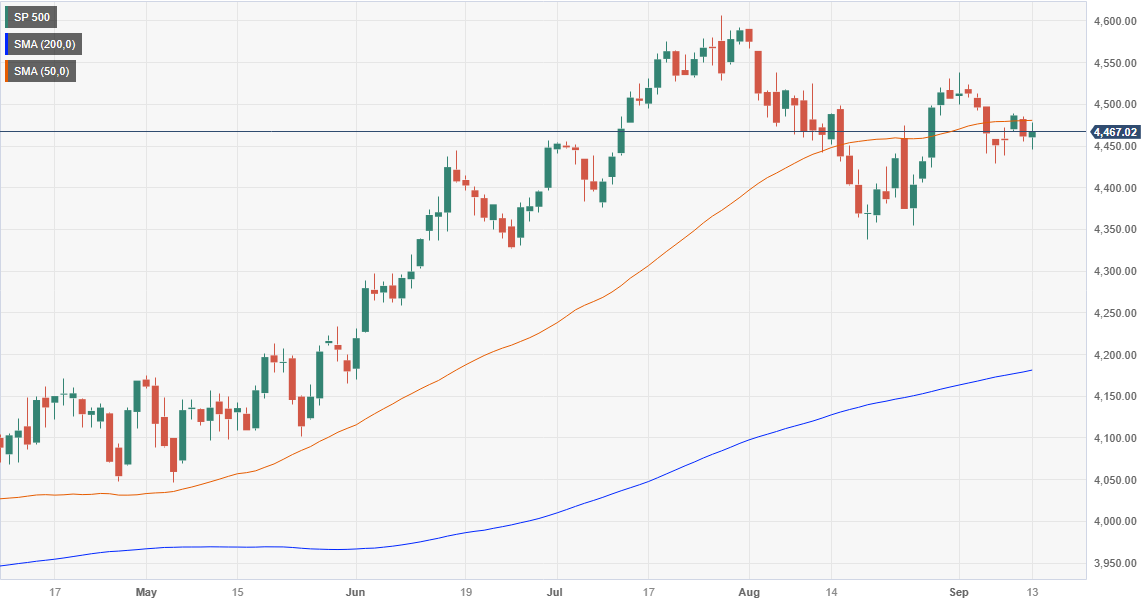
S&P 500 Technical Levels
Author

Christian Borjon Valencia
FXStreet
Markets analyst, news editor, and trading instructor with over 14 years of experience across FX, commodities, US equity indices, and global macro markets.


