S&P 500 faces rising uncertainty ahead of earnings season

Stocks are set to open slightly lower - are they forming a topping pattern?
On Friday, the S&P 500 index closed 0.33% lower amid tariff-related uncertainty. Over the weekend, news of potential new tariffs on Europe from President Trump caused a sharp drop in S&P 500 futures. However, the market has since shrugged off most of those fears, and the index is now expected to open just 0.2% lower.
Investors are now turning their attention to the upcoming corporate earnings season, with major banks set to begin reporting tomorrow. Additionally, key Consumer Price Index (CPI) data will be released, adding to the significance of Tuesday's session.
Investor sentiment remains elevated, as reflected in the last Wednesday’s AAII Investor Sentiment Survey, which reported that 41.4% of individual investors are bullish, while 35.6% are bearish.
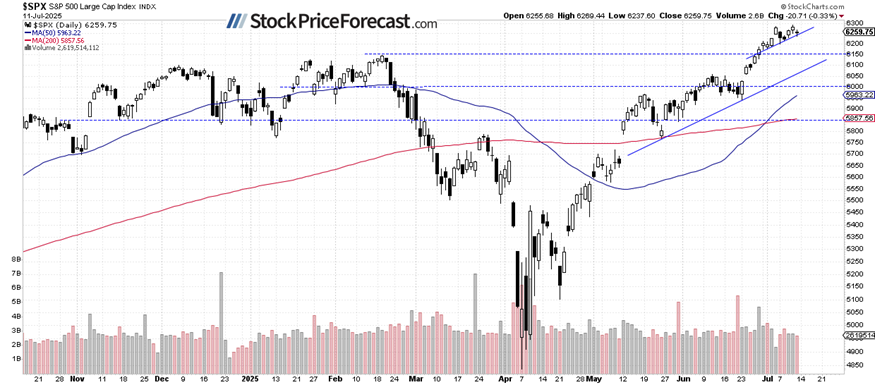
The S&P 500 continues its short-term consolidation, as the daily chart shows.
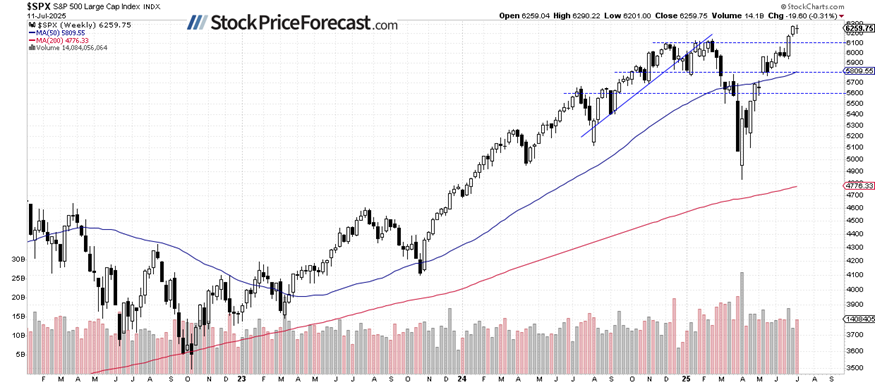
Weekly chart: Sideways action
Last week, the S&P 500 closed 0.31% lower, following a 1.7% gain the week before. Support remains near the 6,150 level - the highs from January and February - while resistance is currently at 6,300.
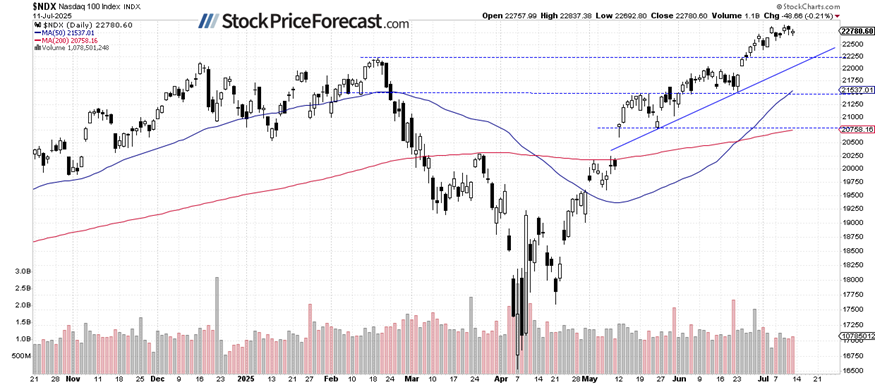
Nasdaq 100: Moving sideways
The Nasdaq 100 dipped 0.21% on Friday, continuing its short-term consolidation. The index still appears to be consolidating within an ongoing uptrend. While no strong negative signals have emerged, recent price action could be forming a potential topping pattern.
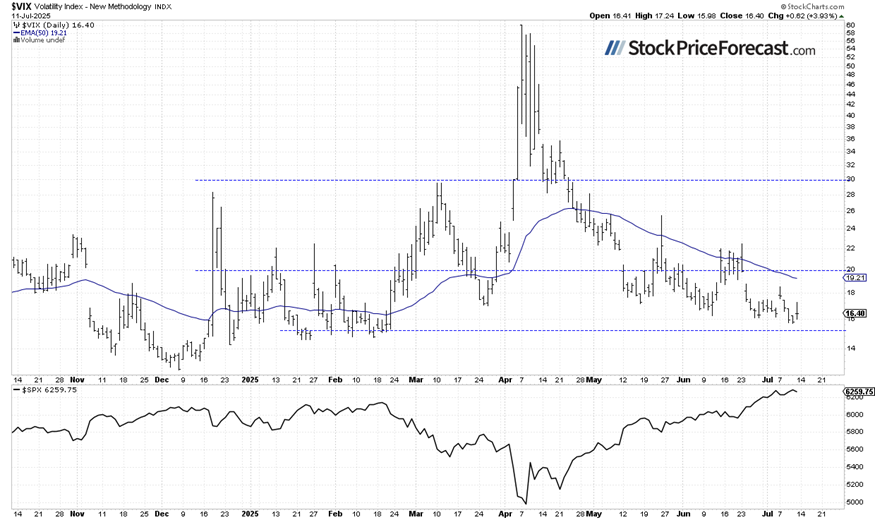
VIX rebounded from Its thursday low
The Volatility Index (VIX) dropped to a local low of 15.70 on Thursday, signaling continued strength in equities. On Friday, however, the VIX rebounded to a daily high of 17.24 despite relatively calm market action.
Historically, a dropping VIX indicates less fear in the market, and rising VIX accompanies stock market downturns. However, the lower the VIX, the higher the probability of the market’s downward reversal. Conversely, the higher the VIX, the higher the probability of the market’s upward reversal.
S&P 500 futures contract: Fluctuations around 6,300
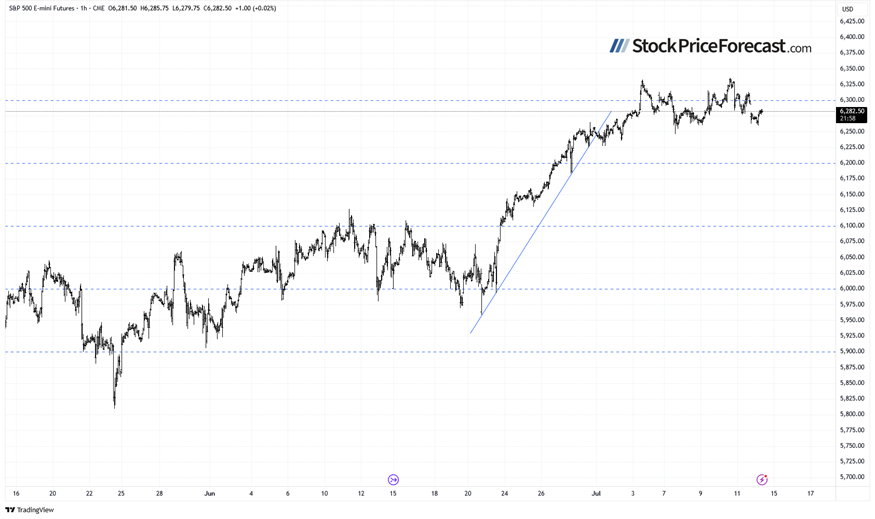
This morning, the S&P 500 futures contract is rebounding from an overnight low of around 6,258, following initial weakness tied to Trump’s tariff headlines over the weekend.
The index remains in consolidation, potentially forming either a topping pattern or a flat correction before another leg higher. Resistance is around 6,320, with support near 6,250.
Markets remain highly sensitive to geopolitical developments and could stay volatile in the near term.
Crude Oil update: Breaking higher
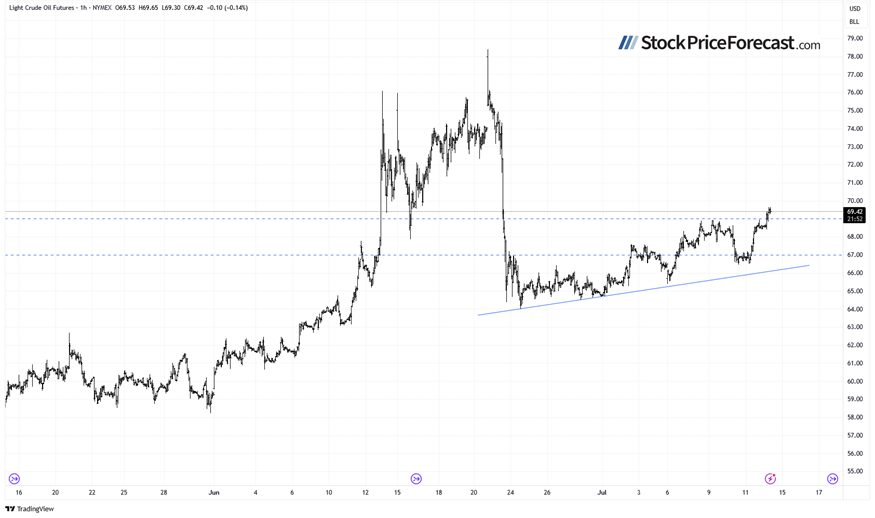
Crude oil rose 2.82% on Friday, continuing its rebound from the sharp June 23–24 sell-off. As of this morning, oil is up another 1.3%, trading above the $69 level.
For oil markets specifically, these developments are worth monitoring:
-
Oil prices surged to a three-week high, driven by expectations of tighter global supply due to increased Chinese imports and potential new U.S. sanctions on Russia.
-
Market sentiment was buoyed by China’s June oil imports rising 7.4% year-over-year and a 3.4% drop in Russia’s oil product exports. Analysts also noted that much of the global inventory build is outside key locations, reinforcing supply tightness concerns.
-
Additional upward pressure came from geopolitical tensions, as President Trump prepared a major announcement on Russia and backed further military support to Ukraine, while the U.S. and EU moved closer to implementing new sanctions and oil price caps.
Oil: Three-week high
Currently, crude is trading above $69. Resistance is around $70-72, while support is between $68-69.
My short-term outlook on oil remains neutral.
Conclusion
The S&P 500 is set to open slightly lower on Monday. Despite the negative open, the market tone is cautiously bullish, especially given the quick recovery from the weekend futures drop.
With tariff-related news still circulating, investor focus will shift toward the start of earnings season and Tuesday’s key CPI data.
Here’s the breakdown:
-
The S&P 500 remains in a consolidation ahead of earnings and economic data.
-
The recent rally extended gains for those who bought based on my Volatility Breakout System.
-
There are no clear bearish signals yet, but a deeper downward correction is not out of the question at some point.
Want free follow-ups to the above article and details not available to 99%+ investors? Sign up to our free newsletter today!
Want free follow-ups to the above article and details not available to 99%+ investors? Sign up to our free newsletter today!
Author

Paul Rejczak
Sunshine Profits
Paul Rejczak is a stock market strategist who has been known for the quality of his technical and fundamental analysis since the late nineties.


