S&P 500 Elliott Wave technical analysis [Video]
![S&P 500 Elliott Wave technical analysis [Video]](https://editorial.fxstreet.com/images/Markets/Equities/SP500/wall_street_nyse1-637299020939878938_XtraLarge.jpg)
S&P 500 Elliott Wave Analysis Trading Lounge Day Chart.
S&P 500 Elliott Wave technical analysis
-
Function: Counter-trend.
-
Mode: Impulsive as Wave C.
-
Structure: Gray Wave C.
-
Position: Orange Wave 4.
-
Next higher degree direction: Orange Wave 5.
Details
The S&P 500 Index is currently in a counter-trend phase, as highlighted by Elliott Wave Analysis on the daily chart. The market is in an impulsive mode, represented by gray Wave C, which forms part of the broader orange Wave 4 structure. This phase follows the completion of gray Wave B, indicating the progression of gray Wave C within orange Wave 4.
Gray Wave C signifies the final impulsive wave of the current corrective phase, completing orange Wave 4. This phase is crucial as it marks the conclusion of the counter-trend movement and sets the stage for the next upward impulsive phase, orange Wave 5, aligning with the broader bullish trend.
The completion of orange Wave 4 and gray Wave C will confirm the end of the corrective sequence, creating the foundation for orange Wave 5 to resume the upward trajectory. Orange Wave 5 is anticipated to represent a continuation of the larger impulsive structure, signaling renewed bullish momentum.
Summary
The S&P 500 Index is navigating through a counter-trend corrective phase, with gray Wave C currently unfolding within orange Wave 4. This phase represents the final stage of the ongoing correction, paving the way for the anticipated transition to orange Wave 5. The development of gray Wave C is pivotal in confirming the end of the correction and preparing the market for the next upward impulsive phase. As gray Wave C progresses, it offers valuable insights into future price movements and the direction of the broader bullish trend.

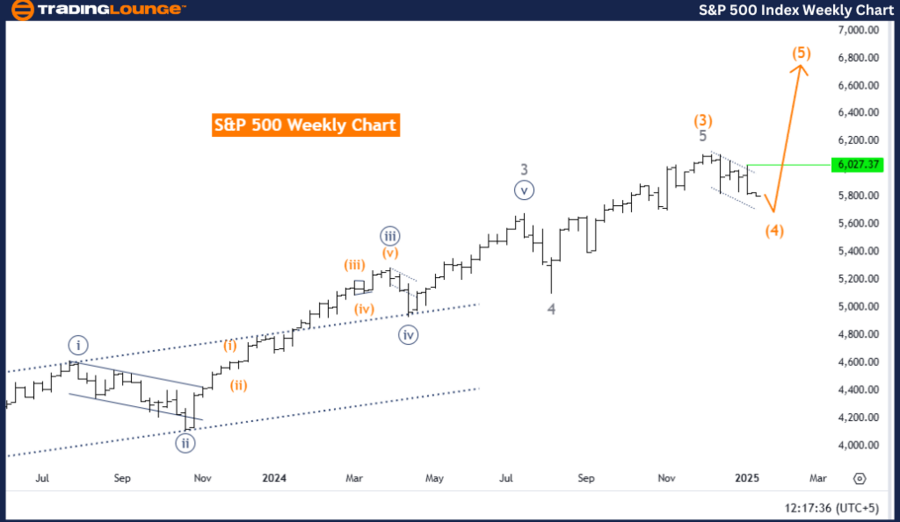
S&P 500 Elliott Wave Analysis Trading Lounge weekly chart.
S&P 500 Elliott Wave technical analysis
-
Function: Counter-trend
-
Mode: Corrective
-
Structure: Likely Zigzag
-
Position: Orange Wave 4
-
Next Higher Degree Direction: Orange Wave 5
Details
The S&P 500 Index is currently in a counter-trend phase, as indicated by Elliott Wave Analysis on the weekly chart. The market is experiencing a corrective movement, likely forming a zigzag pattern within orange Wave 4. This phase follows the completion of orange Wave 3, representing a temporary retracement in the broader bullish trend.
Orange Wave 4 constitutes a corrective phase within the overall impulsive structure. Likely forming a zigzag, this wave features a three-part structure, reflecting an orderly and well-defined correction. Once orange Wave 4 concludes, the market is expected to transition into orange Wave 5, resuming the upward momentum in line with the higher-degree bullish trend.
The completion of orange Wave 3 confirms the market's readiness for a corrective pullback, with orange Wave 4 acting as a necessary phase before continuing the broader impulsive cycle. This corrective wave provides a pause in the upward trend, allowing the market to consolidate before advancing further.
Summary
The S&P 500 Index is in a corrective phase represented by orange Wave 4 on the weekly chart. Likely forming a zigzag pattern, this phase follows the completion of orange Wave 3 and serves as a temporary counter-trend movement. The conclusion of orange Wave 4 will mark the beginning of orange Wave 5, continuing the bullish trend. The development of orange Wave 4 is essential for maintaining the Elliott Wave pattern's structural integrity, offering valuable insights into future market movements and the broader trend direction.
S&P 500 Elliott Wave technical analysis [Video]
Author

Peter Mathers
TradingLounge
Peter Mathers started actively trading in 1982. He began his career at Hoei and Shoin, a Japanese futures trading company.


