|

S&P 500 E-Mini (ES_F) Elliott Wave: Blue box buy setup explained

As our members know we have had many profitable trading setups recently.  In this technical article, we are going to present another Elliott Wave trading setup we got in SPX E-Mini ( ES_F ) . ES_F completed this correction precisely at the Equal Legs zone, referred to as the Blue Box Area. In the following sections, we will delve into the specifics of the Elliott Wave pattern observed , discuss the trading setup and present targets.

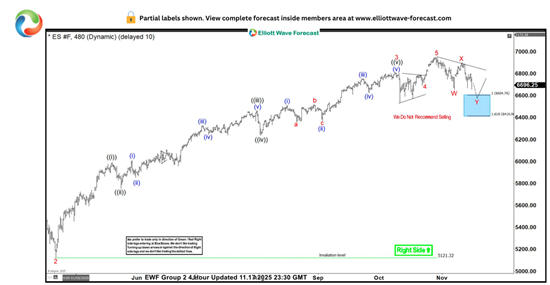
ES_F Elliott Wave four-hour chart 11.17.2025

The current view suggests that ES_F is forming a Double Three correction (WXY red) . The price action shows an incomplete structure from the peak. We anticipate an extension toward the extreme zone at 6004.76-6416.9, where we are looking to re-enter as buyers.

We recommend members to avoid selling ES_F . As the main trend remains bullish, we anticipate at least a 3-wave bounce from this Blue Box area. Once the price touches the 50 fibs against the X red connector, we’ll make positions risk-free and set the stop loss at breakeven and book partial profits. On other hand, breaking below the 1.618 Fibonacci extension level at 6416.9 would invalidate the trade.

Chart

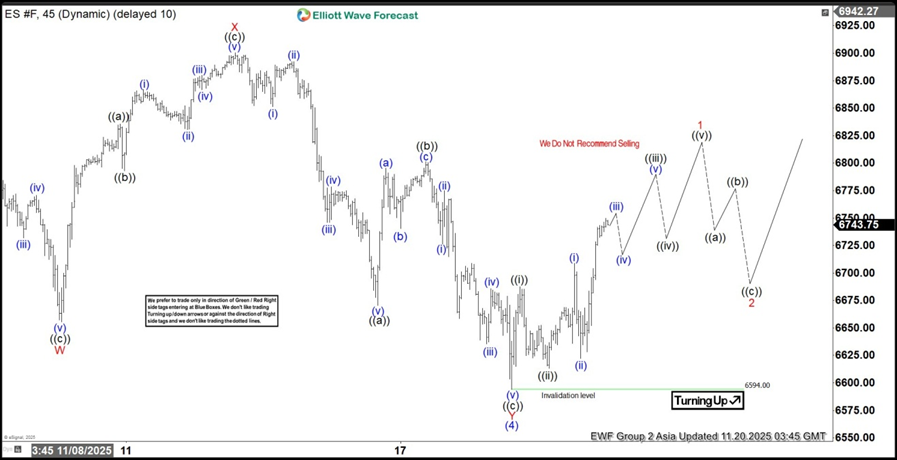
ES_F Elliott Wave one-hour chart 11.17.2025

The futures has made extension down toward Blue Box  (6004.76-6416.9,) and found buyers as expected. ES_F is showing a decent bounce from the Buying Zone. The reaction reaches 50 Fibs zone against the X red connector. Consequently, any long positions from the Blue Box should now be risk-free. We’ve set our stop loss at breakeven and have already secured partial profits. We count correction completed at 6594 low. While above that level, ES_F can be heading toward 7031 + area.

Chart

Author

Elliott Wave Forecast Team

Elliott Wave Forecast Team

ElliottWave-Forecast.com

More from Elliott Wave Forecast Team
Share:

Markets move fast. We move first.

Orange Juice Newsletter brings you expert driven insights - not headlines. Every day on your inbox.

By subscribing you agree to our Terms and conditions.

Editor's Picks

EUR/USD posts modest gains above 1.1700 as ECB signals pause

The EUR/USD pair posts modest gains around 1.1710 during the early Asian session on Monday. The Euro strengthens against the Greenback after the European Central Bank left its policy rates unchanged and took a more positive view on the Eurozone economy, which has shown resilience to global trade shocks. Financial markets are likely to remain subdued as traders book profits ahead of the long holiday period.

GBP/USD steadies below 1.3400 as traders assess BoE policy outlook

Following Thursday's volatile session, GBP/USD moves sideways below 1.3400 on Friday. Investors reassess the Bank of England's policy oıtlook after the MPC decided to cut the interest rate by 25 bps by a slim margin. Meanwhile, the improving risk mood helps the pair hold its ground.

Gold advances above $4,350 amid renewed geopolitical tensions

Gold is rising back above $4,350 early Monday, helped by renewed geopolitical tensions. Israel-Iran conflict and US-Venezuela headlines drive investors toward the traditional store of value, Gold. 

Week ahead: Key risks to watch in last days of 2025 and early 2026

The festive period officially starts next week, with many traders vacating their desks until the first full week of January, making way for thin trading volumes and very few top-tier releases.

How much can one month of soft inflation change the Fed’s mind?

One month of softer inflation data is rarely enough to shift Federal Reserve policy on its own, but in a market highly sensitive to every data point, even a single reading can reshape expectations. November’s inflation report offered a welcome sign of cooling price pressures. 

XRP rebounds amid ETF inflows and declining retail demand demand

XRP rebounds as bulls target a short-term breakout above $2.00 on Friday. XRP ETFs record the highest inflow since December 8, signaling growing institutional appetite.