|

S&P 500 closes week lower amid surging volatility and skyrocketing US yields

  • S&P 500 closes down at 4450.32, losing 1.22%, as Technology, Consumer Discretionary, and Energy sectors led the decline.
  • Upbeat US economic data, including a rise in the Empire State Manufacturing Index, fuels optimism that the Fed may achieve a soft landing.
  • US 10-year Treasury yields climb to 4.334%, adding to market jitters, while WTI oil prices rise by 0.56% due to tight supplies.

Wall Street finished the week on a lower note, as a pile of expiring options and an index rebalance sparked volatility in the US equity markets after printing weekly highs during the last two trading days. This, alongside upbeat US economic data and a jump in US Treasury bond yields, turned sentiment sour.

S&P 500 loses 1.22% as expiring options and index rebalance add volatility, despite optimism about a Fed’s soft landing

The S&P 500 registered solid losses of 1.22%, down at 4450.32, while the heavy-tech Nasdaq 100 erased 1.56% of its hard-earned gains, ending at 13,813.59. At the same time, the Dow Jones Industrial Average fell 0.83% and finished the session at 34,618.24

Sector-wise, the biggest losers were Technology, Consumer Discretionary, and Energy, each losing 1.95%, 1.88%, and 1.32%. The least damaged were Utilities, Real Estate, and Industrials, erasing from its value 0.49%, 0.51%, and 0.53%, respectively.

US economic data revealed on Friday echoed an upbeat tone amongst investors, who are optimistic the Federal Reserve would achieve a soft landing. The University of Michigan showed that despite consumer sentiment deteriorating, Americans see a ray of light regarding lower prices. According to the UoM survey, inflation expectations lowered to 3.1% in September for one year and 2.7% for a 5-year horizon.

The New York Fed released its Empire State Manufacturing Index, which rose sharply, crushing last month’s figures and the consensus. At the same time, the Federal Reserve announced that Industrial Production in August expanded by 0.4%, above forecasts but trailed July’s data.

Today’s data, summed up with the previous one revealed in the week, raised speculation the Fed might achieve a soft landing. In the meantime, money market futures remain certain the Fed would skip hiking rates next week when the US central bank meets in Washington, in the only meeting in Q3.

US Treasury bond yields finished the session with the 10-year benchmark note rate at 4.334%, gained 0. 98%. The Greenback, as shown by the US Dollar Index, ended positively, climbing 0.01%, at 105.33..

WTI rose by 0.56% daily in the commodity space underpinned by tight supplies after Saudi Arabia and Russia’s 1.3 million barrel crude oil cut.

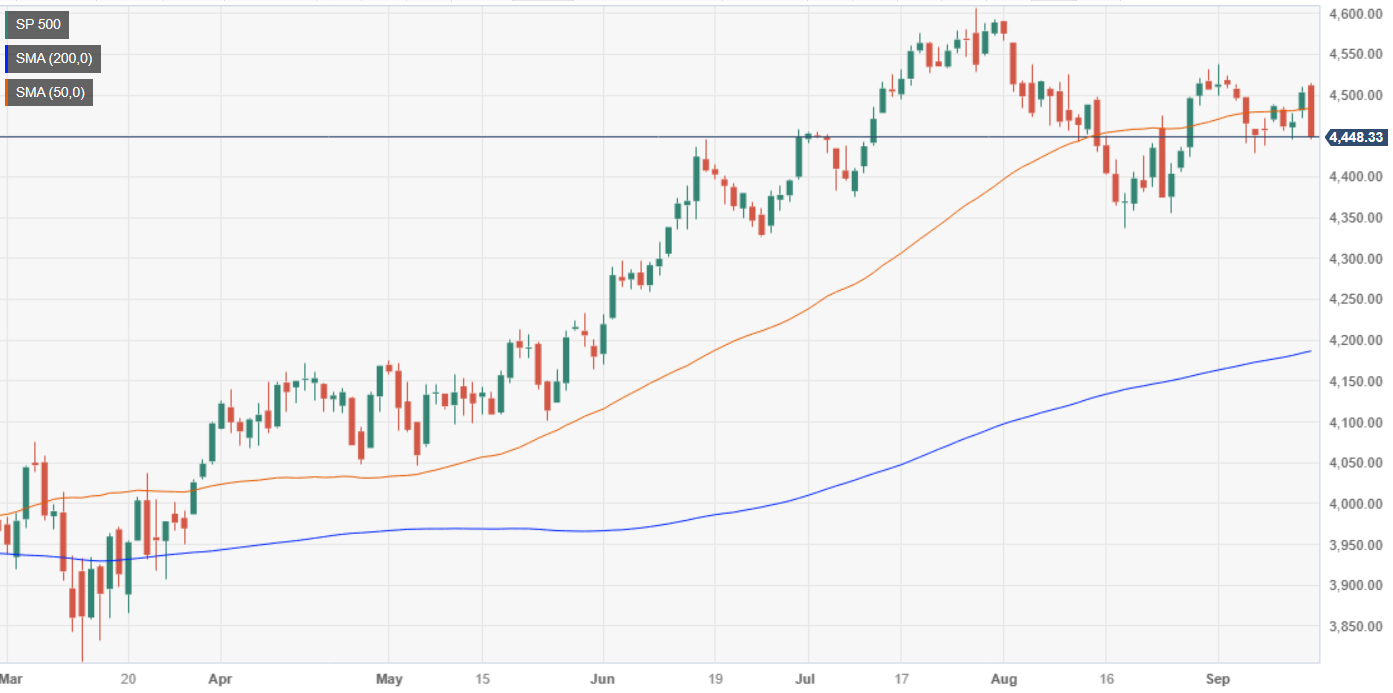
S&P 500 Price Action – Daily Chart

S&P 500 Technical Levels

SP 500

Overview
Today last price4448.33
Today Daily Change-54.93
Today Daily Change %-1.22
Today daily open4503.26
 
Trends
Daily SMA204456.5
Daily SMA504482.68
Daily SMA1004370.87
Daily SMA2004185.62
 
Levels
Previous Daily High4510.13
Previous Daily Low4471.71
Previous Weekly High4524.32
Previous Weekly Low4429.15
Previous Monthly High4590.64
Previous Monthly Low4337.34
Daily Fibonacci 38.2%4495.45
Daily Fibonacci 61.8%4486.39
Daily Pivot Point S14479.94
Daily Pivot Point S24456.61
Daily Pivot Point S34441.52
Daily Pivot Point R14518.36
Daily Pivot Point R24533.45
Daily Pivot Point R34556.78

Author

Christian Borjon Valencia

Christian Borjon began his career as a retail trader in 2010, mainly focused on technical analysis and strategies around it. He started as a swing trader, as he used to work in another industry unrelated to the financial markets.

More from Christian Borjon Valencia
Share:

Markets move fast. We move first.

Orange Juice Newsletter brings you expert driven insights - not headlines. Every day on your inbox.

By subscribing you agree to our Terms and conditions.

Editor's Picks

EUR/USD eyes 1.1800 barrier near two-month highs

EUR/USD extends its gains for the second consecutive day on Tuesday and approaches 1.1800. On the daily chart, technical analysis indicates a persistent bullish bias, as the pair moves upward within the ascending channel pattern. Additionally, the 14-day Relative Strength Index at 68.89 reaffirms the bullish bias.

GBP/USD climbs to 1.3500 area, renews ten-week high

GBP/USD extends its weekly rally and trades at its highest level since early October near 1.3500. The US Dollar remains under persistent bearish pressure heading into the holidays, while Pound traders largely brush off the latest interest rate cut from the Bank of England.

Gold approaches $4,500 as record-setting rally continues

Gold builds on Monday's impressive gains and advances toward $4,500, setting fresh record-highs along the way. Heightened geopolitical tensions, combined with the broad-based US Dollar (USD) weakness ahead of the Q3 GDP data, help XAU/USD preserve its bullish momentum.

Uniswap holds above $6 as traders eye UNIfication vote outcome

Uniswap price holds above $6 at the time of writing on Tuesday after closing above a key resistance zone in the previous week. Traders are focusing on the highly anticipated UNIfication proposal, which is set to conclude on Thursday, and could become a key near-term catalyst. On the technical side, momentum indicators are flashing bullish signals, hinting at an upside rally.

Ten questions that matter going into 2026

2026 may be less about a neat “base case” and more about a regime shift—the market can reprice what matters most (growth, inflation, fiscal, geopolitics, concentration). The biggest trap is false comfort: the same trades can look defensive… right up until they become crowded.

XRP steadies above $1.90 support as fund inflows and retail demand rise

Ripple (XRP) is stable above support at $1.90 at the time of writing on Monday, after several attempts to break above the $2.00 hurdle failed to materialize last week. Meanwhile, institutional interest in the cross-border remittance token has remained steady.