|

SMH Semiconductor ETF should continue pushing to the upside

The VanEck Semiconductor ETF (SMH) is an exchange-traded fund that tracks a market-cap weighted index composed of 25 of the largest U.S.-listed semiconductor companies. The top holdings of SMH include companies like NVIDIA, Taiwan Semiconductor Manufacturing, Broadcom Inc., Texas Instruments, QUALCOMM, ASML Holding N.V., Applied Materials, Inc., Lam Research Corporation, Micron Technology, Inc., and Advanced Micro Devices, Inc.

SMH four-hour chart May 23th

Chart

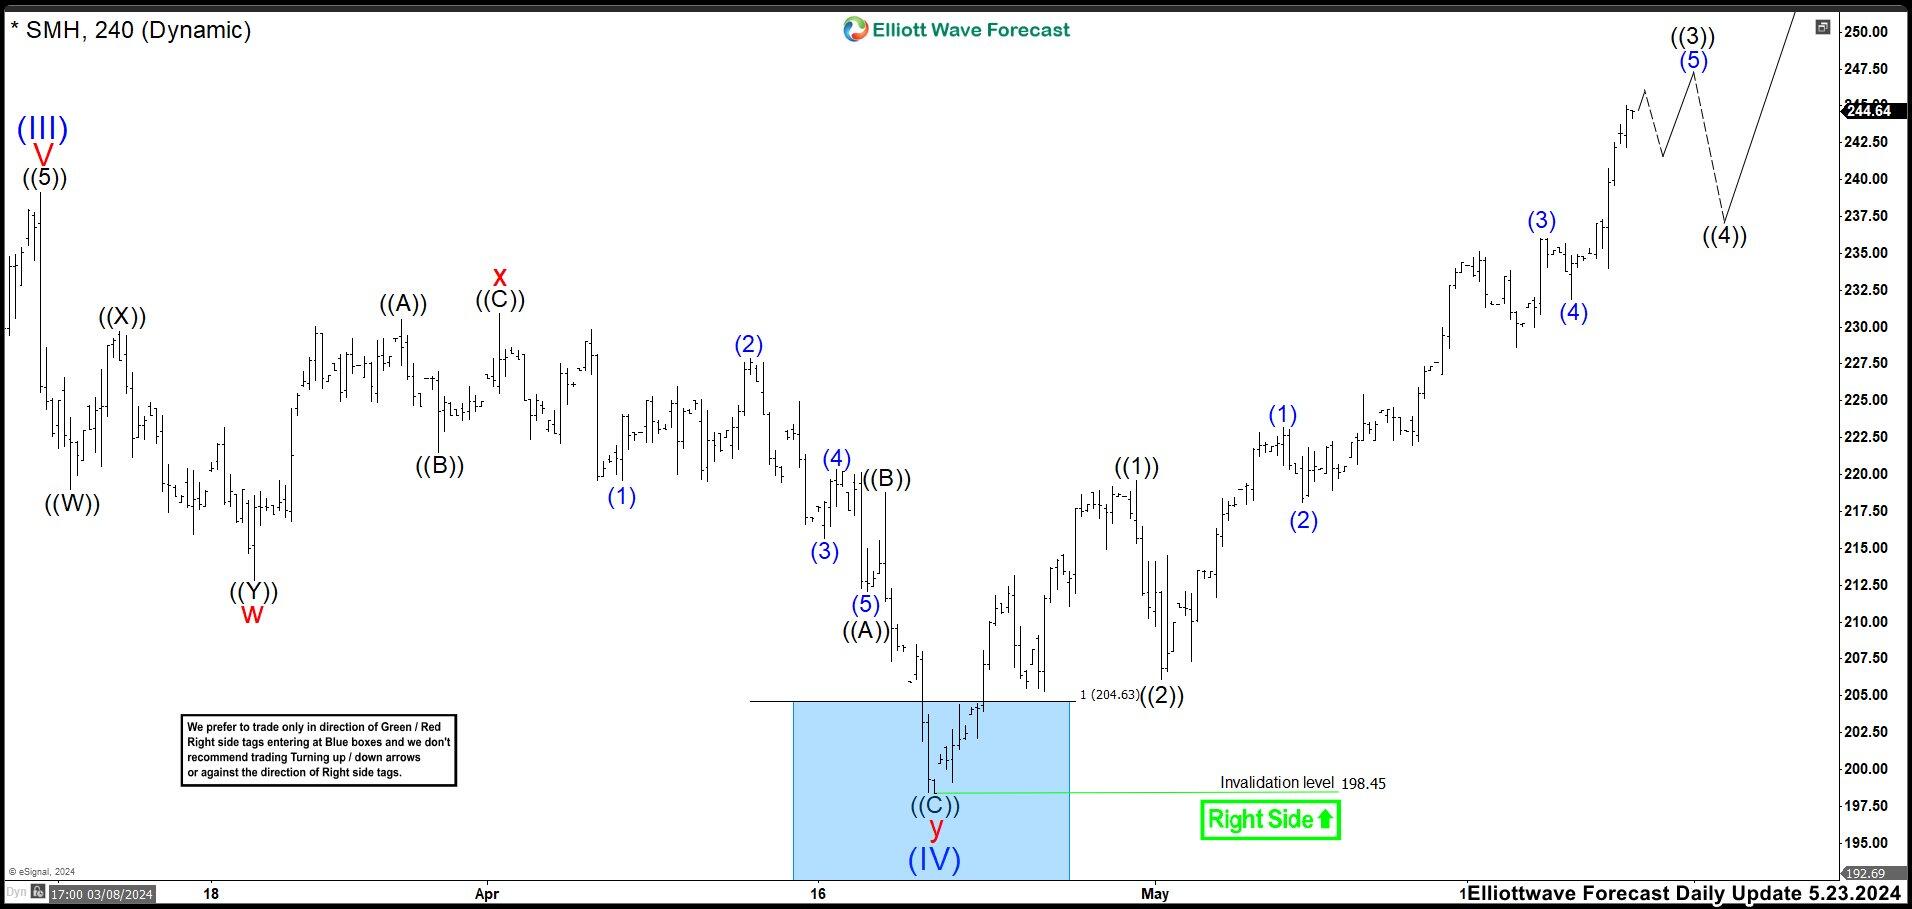
In May, we showed how SMH had reached the proposed blue box area. The idea was to look for buying opportunities in the zone to continue the upward movement. This correction ended a wave (IV) at 198.45 low and it had to continue with wave (V) that broke the peak of wave (III). In the chart, it can be seen that the market broke wave (III) high as we expected.

SMH four-hour chart blue box reaction

Chart

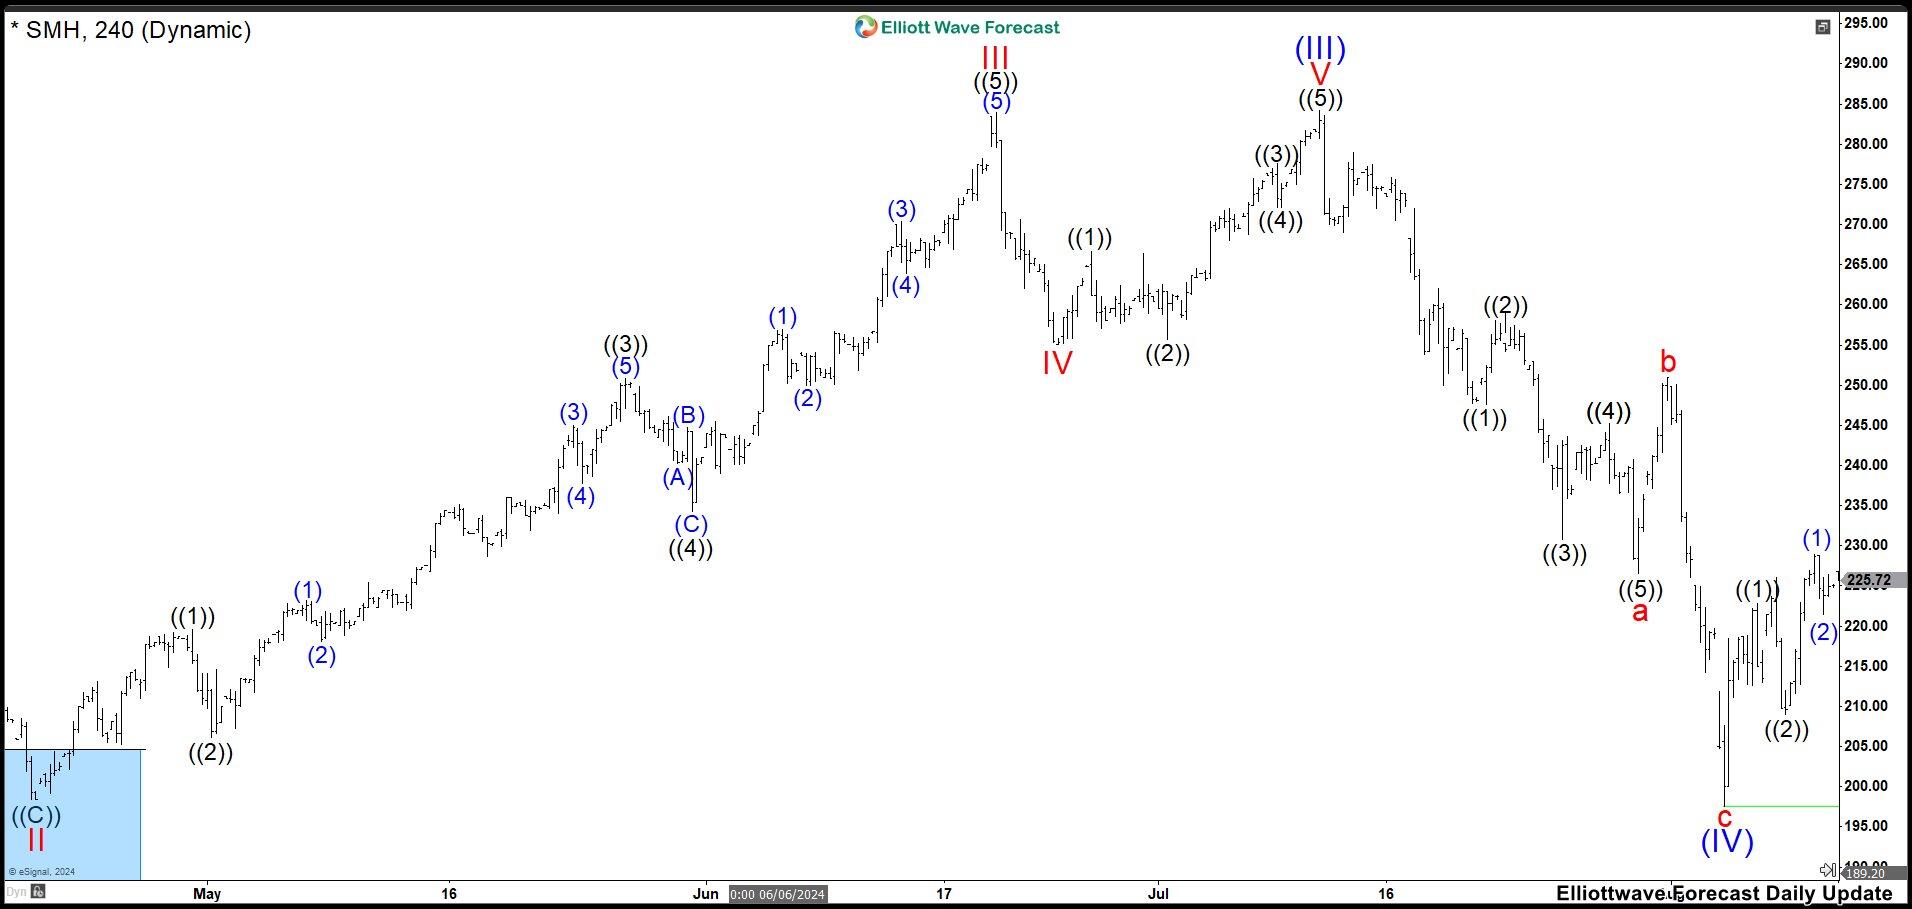
In the chart above, we can clearly see the market reaction from the blue box. We expected to reach as target the price of 265, giving us a profit of more than 29%; however, it reached as high as 284.26. This unexpected extension made us to adjust the count. Suggesting that SMH was still trading in wave (III). Therefore, what was wave (IV) became wave II and thus a wave (III) was formed ending at 284.26 high.

SMH four-hour chart September 11th 

Chart

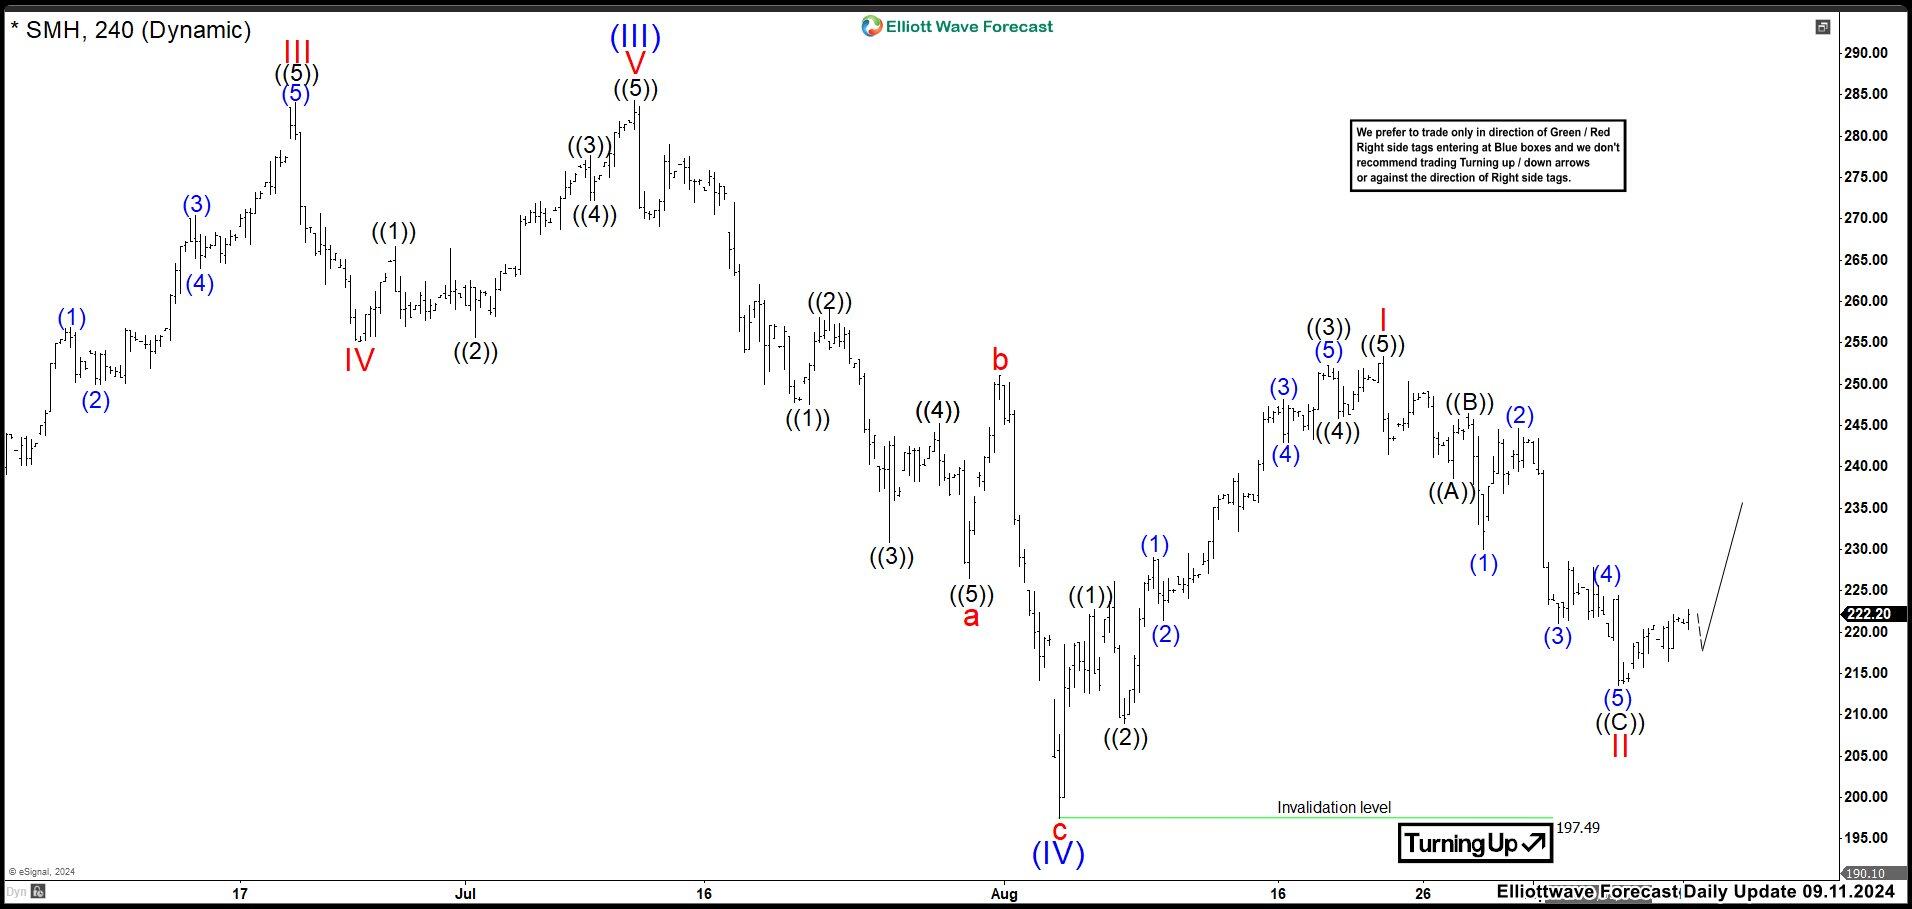
After completing wave (III), we had a deep pullback as a zig zag correction. Down from wave (III), wave “a”ended at 226.50 low and bounce as wave “b” ended at 251.00 high. Last push lower completed wave “c” and a wave (IV) at 197.50 low.  Then, SMH started the uptrend again and wave (V). It built an impulse structure ending at 253.32 high as wave I. Pullback as wave II ended at 213.57 low. From here, we were expecting to continue the rally in wave III of (V). Ideally, the market should break 284.26 high as target to end wave (V). In case, if this rally does not break above wave (III), the next target to keep an eye comes around 269.50 level.

Author

Elliott Wave Forecast Team

Elliott Wave Forecast Team

ElliottWave-Forecast.com

More from Elliott Wave Forecast Team
Share:

Editor's Picks

EUR/USD climbs above 1.1600 on US–Iran peace breakthrough

The EUR/USD pair stays firm above 1.1600 in the European session on Monday. The US and Iran have reached a deal to reopen the Strait of Hormuz on Sunday, which underpins risk sentiment, supporting the Euro against the US Dollar. Now, the main focus this week remains on the Fed policy decision due on Wednesday.

GBP/USD: US-Iran reaches deal supporting advance beyond 20-day EMA

The GBP/USD pair trades 0.35% higher to near 1.3460 during the late Asian trading session. The Cable extends its week-long advance as market sentiment improves further, following the announcement that the United States and Iran have reached a deal.

Gold gains momentum as US, Iran announce a peace deal

Gold price rises to a weekly high during the early European trading hours on Monday. The precious metal rebounds after the United States and Iran had reached a deal to end their conflict, easing concerns about inflation and higher interest rates.


Bitcoin consolidates gains, Ethereum defends support, XRP nears breakout trigger


Bitcoin, Ethereum and Ripple begin the week on a constructive note as the top three cryptocurrencies attempt to extend rebounds after recovering nearly 4%, 2% and 2.6%, respectively. BTC steadies around $65,600, ETH continues to hold firmly above the key $1,700 support, while XRP nears the upper boundary of the falling channel pattern. 

President Trump announced that the deal with Iran is complete
President Trump announced that the deal with Iran is complete and he authorises the toll-free opening of the Strait of Hormuz and removal of the US Naval blockade. While the agreement is made, it is expected to be signed on Friday to take effect. The Forex market looks stable and could react slowly to the positivity around the news as Iran still expresses its mistrust on the US.
4.2% headline, 0.2% core: Why the Fed's next hike may be targeting the wrong problem

May's CPI put headline inflation at 4.2% on the year, up from 3.8% in April and the hottest reading since April 2023, while core prices rose just 0.2% on the month, undershooting the 0.3% consensus and halving April's pace.