Silver stalls as markets weigh Israel–Iran tensions and the US Dollar
- Silver prices are stalling above the key psychological level of $36.00, now acting as near-term support following June’s breakout.
- Geopolitical tensions between Israel and Iran remain a key driver, with markets watching for signs of de-escalation that could influence Silver’s safe-haven demand.
- XAG/USD remains sensitive to movements in the US Dollar and Treasury yields, ahead of Wednesday’s FOMC decision and economic projections.

Silver prices are stalling above $36.00 on Monday, with bullish momentum taking a breather after a sharp multi-week rally.
At the time of writing, XAG/USD remains up more than 10% for the month, although the metal now appears to be consolidating as it searches for a fresh directional catalyst.
The US Dollar has lost ground despite the geopolitical backdrop, with its traditional safe-haven status coming under pressure amid political instability and uncertainty over trade policy.
A softer USD has helped keep Silver supported near $36.38, following a modest 0.2% gain from Friday.
The conflict between Israel and Iran, which is on its fourth day, has triggered waves of safe-haven demand. However, signs of a possible diplomatic opening have started to emerge. Reuters and The Wall Street Journal reported that Iran sent messages via Arab intermediaries indicating a willingness to resume nuclear talks with the United States.
This has introduced some hope for de-escalation, limiting further upside in precious metals. However, some Iranian officials have denied these reports.
Additionally, growing speculation around a potential Federal Reserve (Fed) rate cut later this year, particularly ahead of Wednesday’s FOMC meeting, further enhanced Silver’s appeal as a non-yielding hedge asset, helping it hold elevated levels despite fluctuating risk sentiment tied to the Middle East conflict.
Silver technical analysis: XAG/USD holds firm above $36.00
Silver (XAG/USD) is trading near $36.38 on Monday, holding firm after a strong rally through June.
Last week’s breakout cleared long-term resistance at the October 2012 high of $35.92, which now acts as immediate support.
Price action is showing signs of consolidation below the year-to-date high of $36.89, posted last Monday.
Silver (XAG/USD) daily chart
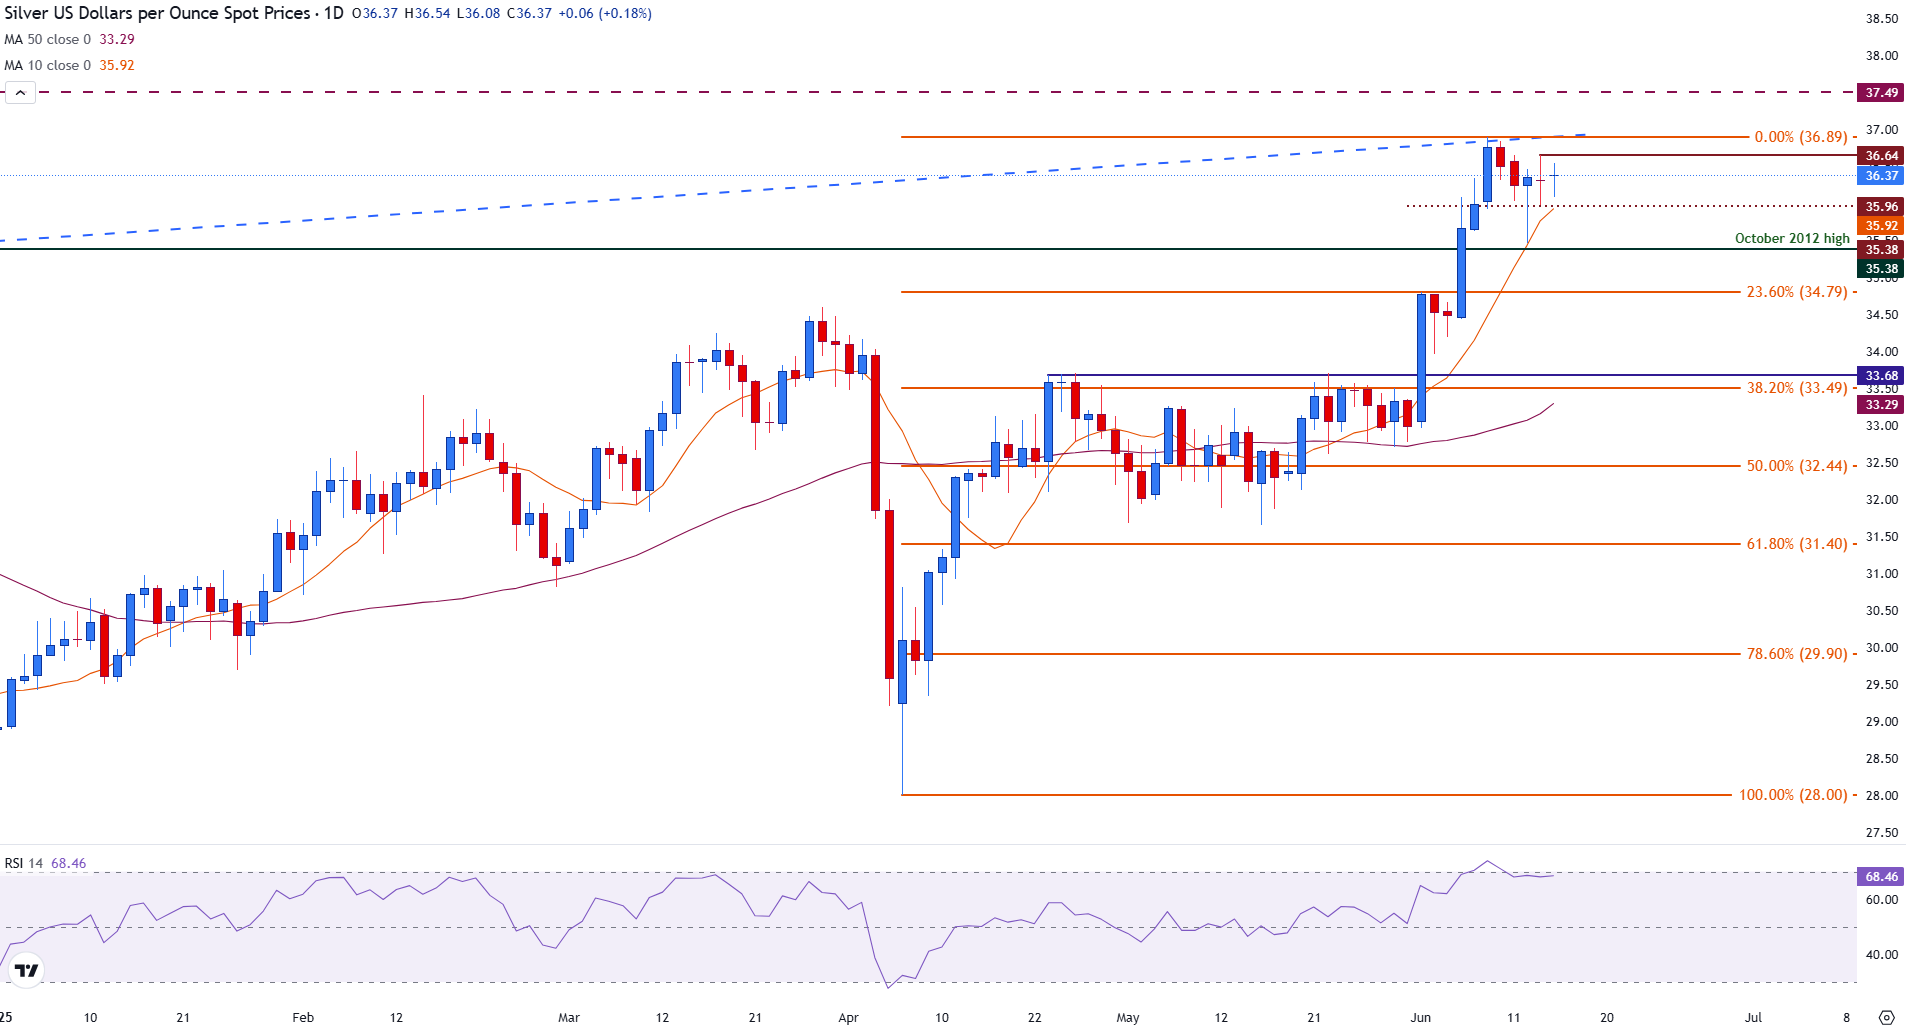
The daily Relative Strength Index (RSI) remains elevated at 68, suggesting bullish momentum is still in play but nearing overbought territory. A sustained break above $36.89 could pave the way for a move toward long-term resistance at $37.49.
Conversely, a drop below $35.92 would expose downside risks, with the next key support level seen at $34.79 and the 38.2% Fibonacci retracement at $33.68, which is closely aligned with the 50-day Simple Moving Average (SMA).
Silver FAQs
Silver is a precious metal highly traded among investors. It has been historically used as a store of value and a medium of exchange. Although less popular than Gold, traders may turn to Silver to diversify their investment portfolio, for its intrinsic value or as a potential hedge during high-inflation periods. Investors can buy physical Silver, in coins or in bars, or trade it through vehicles such as Exchange Traded Funds, which track its price on international markets.
Silver prices can move due to a wide range of factors. Geopolitical instability or fears of a deep recession can make Silver price escalate due to its safe-haven status, although to a lesser extent than Gold's. As a yieldless asset, Silver tends to rise with lower interest rates. Its moves also depend on how the US Dollar (USD) behaves as the asset is priced in dollars (XAG/USD). A strong Dollar tends to keep the price of Silver at bay, whereas a weaker Dollar is likely to propel prices up. Other factors such as investment demand, mining supply – Silver is much more abundant than Gold – and recycling rates can also affect prices.
Silver is widely used in industry, particularly in sectors such as electronics or solar energy, as it has one of the highest electric conductivity of all metals – more than Copper and Gold. A surge in demand can increase prices, while a decline tends to lower them. Dynamics in the US, Chinese and Indian economies can also contribute to price swings: for the US and particularly China, their big industrial sectors use Silver in various processes; in India, consumers’ demand for the precious metal for jewellery also plays a key role in setting prices.
Silver prices tend to follow Gold's moves. When Gold prices rise, Silver typically follows suit, as their status as safe-haven assets is similar. The Gold/Silver ratio, which shows the number of ounces of Silver needed to equal the value of one ounce of Gold, may help to determine the relative valuation between both metals. Some investors may consider a high ratio as an indicator that Silver is undervalued, or Gold is overvalued. On the contrary, a low ratio might suggest that Gold is undervalued relative to Silver.
Author

Tammy Da Costa, CFTe®
FXStreet
Tammy is an economist and market analyst with a deep passion for financial markets, particularly commodities and geopolitics.


