|

Silver Price Prediction: Silver makes tentative break above trendline

  • Silver breaks tentatively above the trendline, however, it is pulling back on Monday. 
  • It is broadly in a short-term uptrend which could extend higher. 

Silver (XAG/USD) has broken tentatively above a key trendline in the $30s. It is not clear whether the break is definitive, however, since Friday’s breakout day has been followed by a pullback on Monday which is testing the trendline.

Silver Daily Chart 

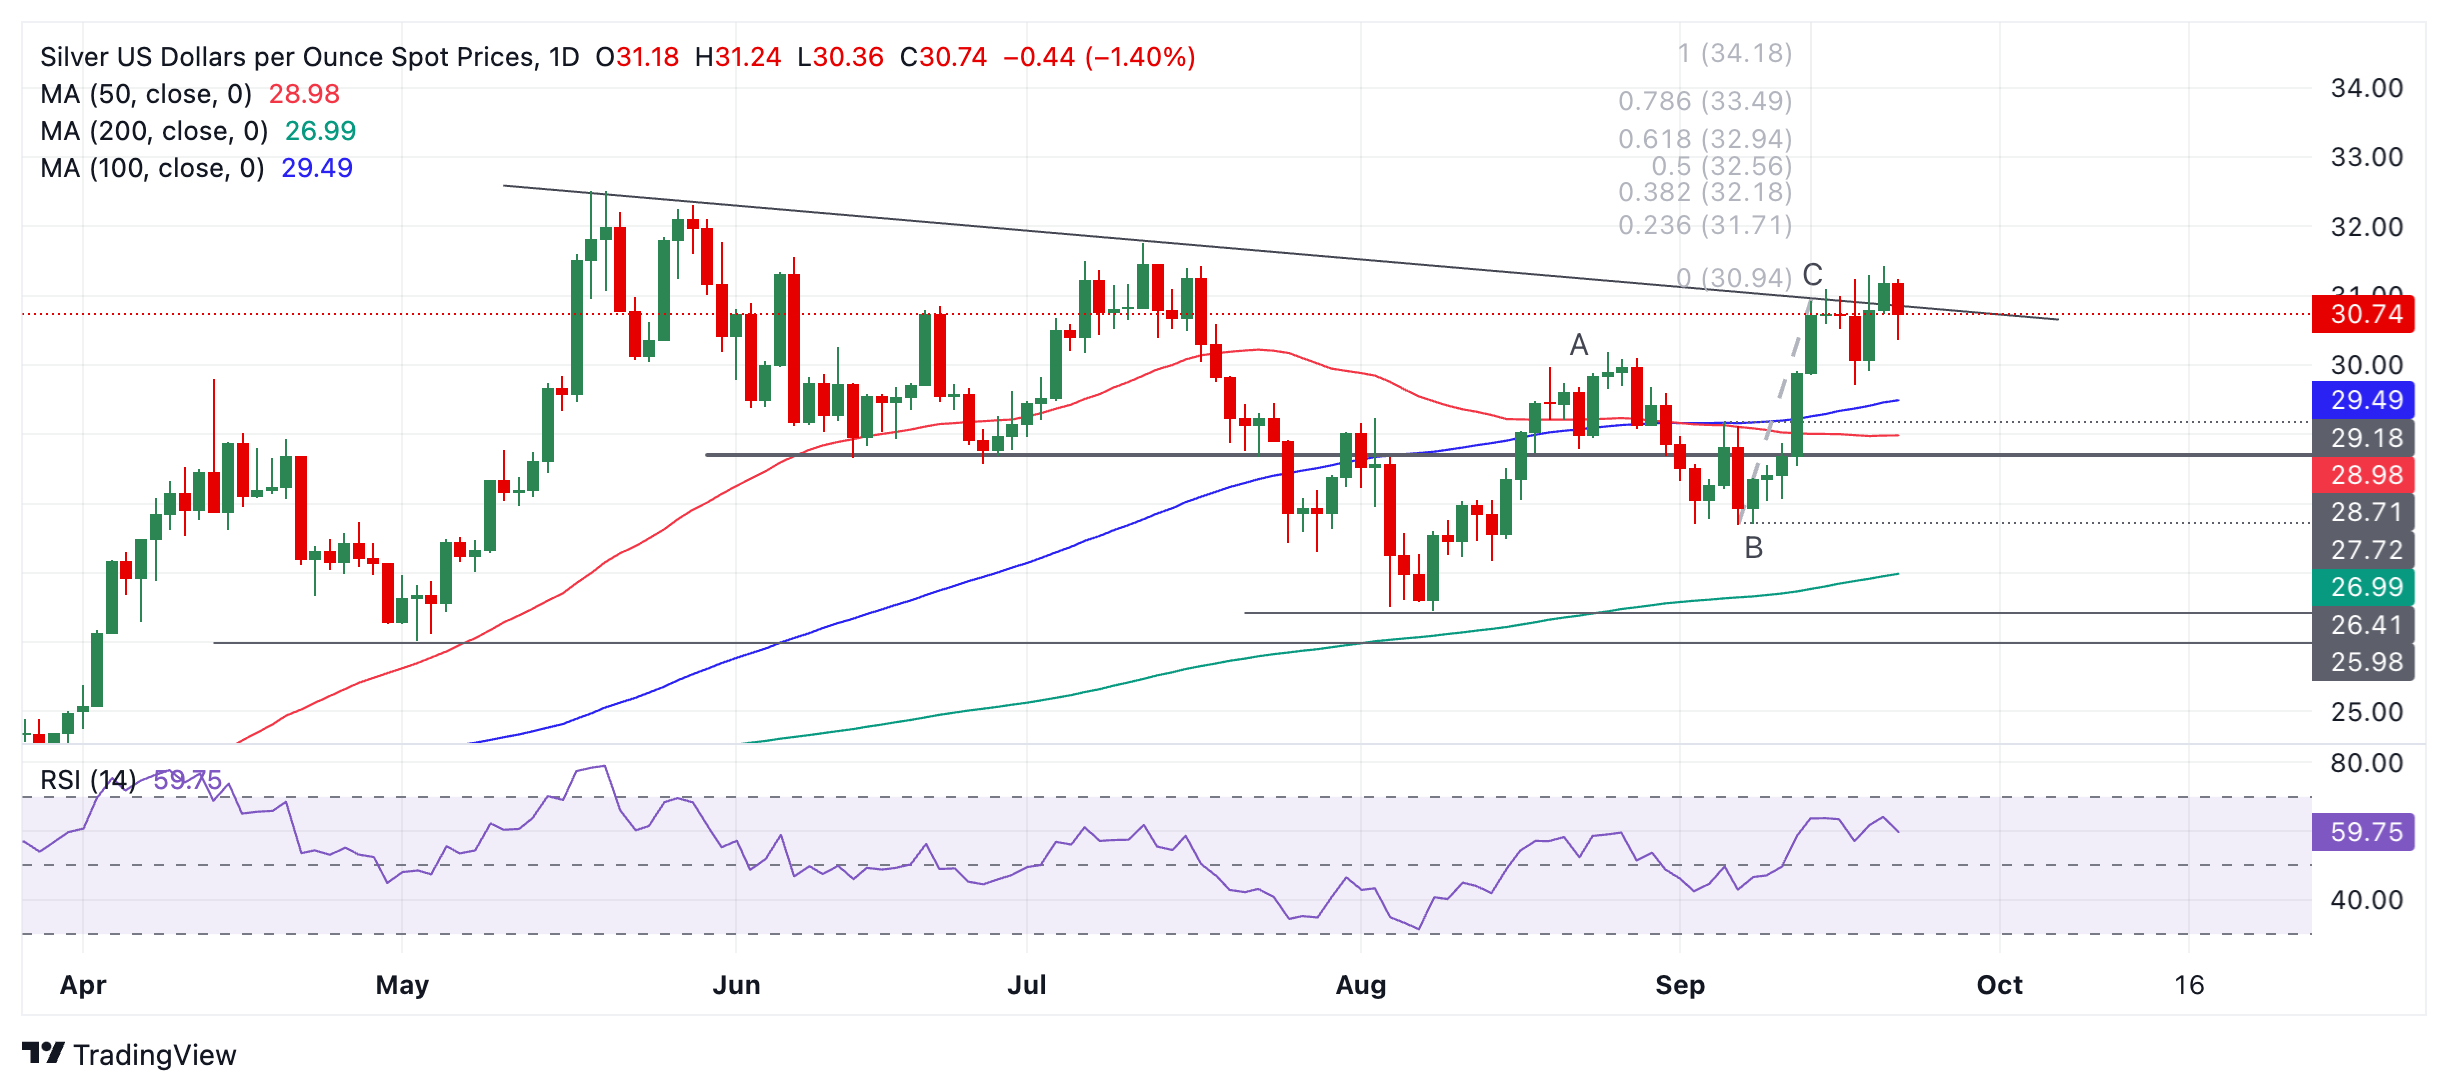
Silver has been in a short-term uptrend ever since the early August lows, except for a period between August 26 and September 3 when it corrected back. As it is a principle of technical analysis that “the trend is your friend” the odds favor more upside. A close above $31.43 (September 20 high) would indicate a probable follow-through to $32.94. 

The move up from the August lows could also be characterized as a Measured Move price pattern. These are large zig-zags composed of three waves, labeled ABC. It is another characteristic of these patterns that waves A and C are usually of a similar length. This is the case with Silver. This suggests the pattern may have finished and prices could pullback, although there is no way of predicting how far. There are no strong signs it is about to correct. 

There is initial support at around $29.50 from the 100-day Simple Moving Average (SMA) followed by $29.18 (June swing lows). 

Silver is in a medium and longer-term sideways trend which provides no underlying cyclical bias in either direction.

Author

Joaquin Monfort

Joaquin Monfort is a financial writer and analyst with over 10 years experience writing about financial markets and alt data. He holds a degree in Anthropology from London University and a Diploma in Technical analysis.

More from Joaquin Monfort
Share:

Editor's Picks

AUD/USD falls to near 0.7100 after slipping below 50-day EMA

AUD/USD depreciates after registering minor gains in the previous day, trading around 0.7120 during the Asian hours. The technical analysis of the daily chart shows the pair consolidating sideways within a rectangle pattern, as neither bulls nor bears gain control. The AUD/USD pair is holding a slight bearish tone however as it sits beneath both the nine-day and 50-day EMAs.

USD/JPY coiling up around 160.00 amid 'Yentervention' threats

USD/JPY sits glued near 160.00 in Asia on Friday, as the Japanese Yen remains supported by persistent 'Yentervention' threats by Japan's officials. However, the pair's downside remains capped by the Mideast tensions-led risk-off mood and the US Dollar's bullish consolidation.

Gold returns to the red, awaits US NFP

Gold price is looking to test the weekly lows, while in the red near $4,450 in the early European session on Friday. The precious metal remains vulnerable amid ongoing geopolitical turmoil. Traders will closely monitor the developments surrounding the US-Iran peace deal and the US May employment report later on Friday.


Indian Rupee jumps as RBI holds, but unveils measures to boost foreign inflows

The Reserve Bank of India held the Repo Rate at 5.25%, as widely expected, on Friday. But the central bank unveiled various measures to boost foreign inflows into the economy, lifting the Indian Rupee against the US Dollar.

Top 3 Price Prediction: Bitcoin eyes $60,000, Ethereum risks $1,750, XRP could test $1

Bitcoin, Ethereum, and Ripple prices edge lower on Friday, extending a steady decline of roughly 15% so far this week. Institutional outflows weigh on Bitcoin and Ethereum while XRP largely follows the broader market trend.

Recession on paper: What really moves the Canadian Loonie now?

Statistics Canada handed the headline writers a gift and the analysts a headache. Real GDP shrank 0.1% on an annualized basis in the first quarter, and with the fourth quarter of 2025 revised down to a 1.0% contraction, that is two negative quarters in a row, the textbook definition of a technical recession and Canada's first since the pandemic.