Silver Price Forecast: XAG/USD wobbles below $33 as investors seek development in US-China trade
- Silver price consolidates around $32.50 as investors look for fresh development in trade talks between the US and China.
- The White House has expressed confidence in the US-China trade deal.
- The tussle between Trump and Fed Powell keeps the US Dollar on the backfoot.

Silver price (XAG/USD) trades sideways around $32.50 during European trading hours on Tuesday. The white metal has turned sideways over the last three trading days as investors look for fresh development in trade relations between the United States (US) and China.
In the second week of this month, US President Donald Trump announced a sudden 90-day pause in the execution of reciprocal tariffs but kept enormous duties on China for retaliation by imposing similar levies on imports from the US.
Meanwhile, Washington has expressed optimism over the US-China trade deal. “We're confident it will work out with China,” US Commerce Secretary Howard Lutnick said over the weekend.
Still, investors are cautious over the US-China trade relations as the fight between Trump and China is more of a “dignity” issue than a "level of tariffs" issue. The scenario of a tussle between the US and China for the longer term will be favorable for safe-haven assets, such as Silver. Historically, precious metals perform strongly in times of heightened global economic tensions.
Last week, White House press secretary Karoline Leavitt said that the President is open to a trade deal with Beijing, but it should make the first move. "The ball is in China’s court: China needs to make a deal with us, we don’t have to make a deal with them,” Leavitt said, Reuters reported.
Meanwhile, the deepening feud between Donald Trump and Federal Reserve (Fed) Chair Jerome Powell over the interest rate policy has battered the US Dollar (USD) badly. Technically, a lower US Dollar makes the Silver price a value bet for investors.
Silver technical analysis
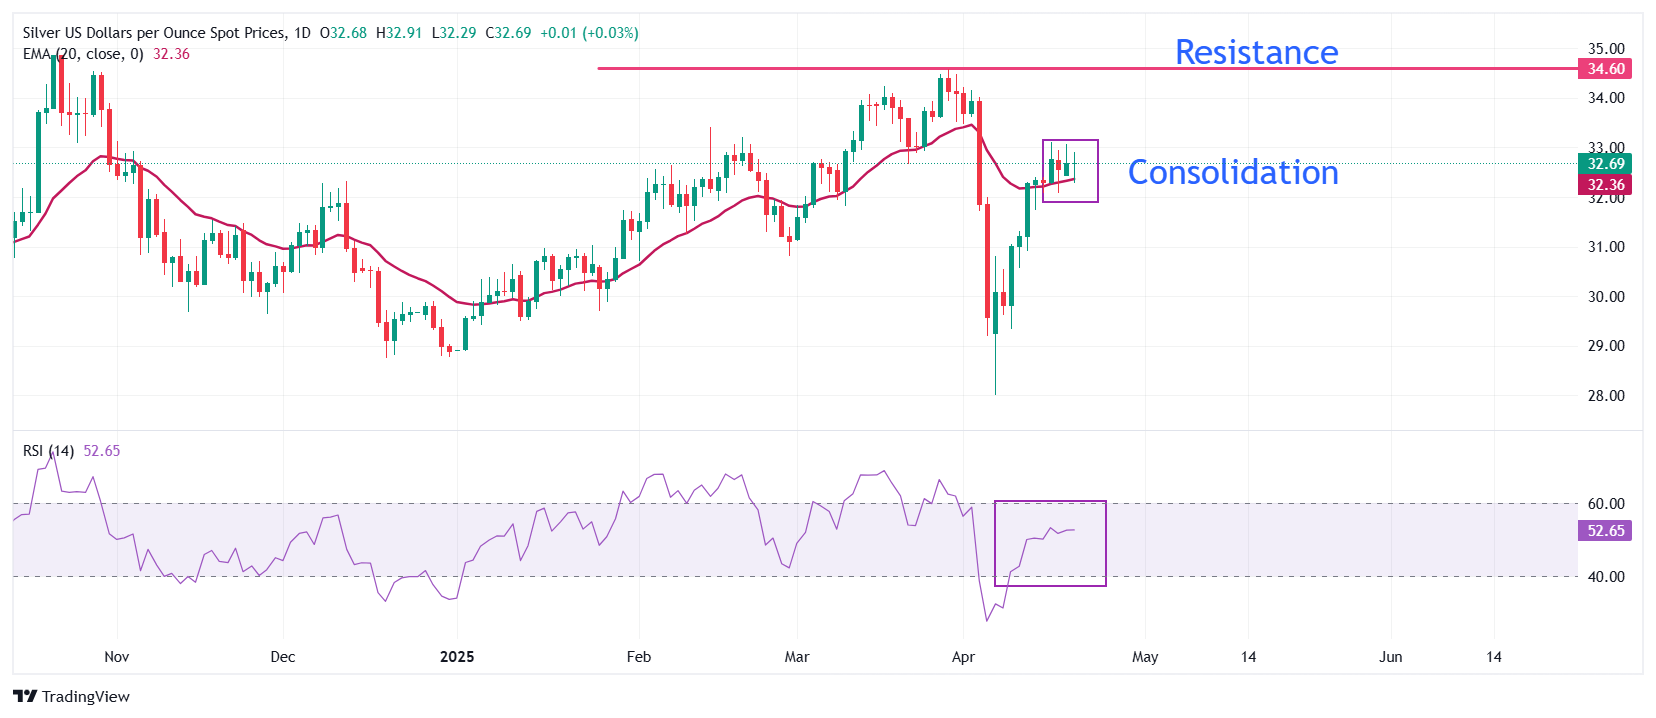
Silver price trades back-and-forth in a range between $32.08 and $33.12 since Wednesday. The white metal turns sideways after a strong upside move since April 7. The 20-day Exponential Moving Average (EMA) near $32.00 continues to provide support to the Silver price.
The 14-day Relative Strength Index (RSI) oscillates in the 40.00-60.00 range, indicating a volatility contraction.
Looking up, the March 28 high of $34.60 will act as key resistance for the metal. On the downside, the April 111 low of $30.90 will be the key support zone.
Silver daily chart
Silver FAQs
Silver is a precious metal highly traded among investors. It has been historically used as a store of value and a medium of exchange. Although less popular than Gold, traders may turn to Silver to diversify their investment portfolio, for its intrinsic value or as a potential hedge during high-inflation periods. Investors can buy physical Silver, in coins or in bars, or trade it through vehicles such as Exchange Traded Funds, which track its price on international markets.
Silver prices can move due to a wide range of factors. Geopolitical instability or fears of a deep recession can make Silver price escalate due to its safe-haven status, although to a lesser extent than Gold's. As a yieldless asset, Silver tends to rise with lower interest rates. Its moves also depend on how the US Dollar (USD) behaves as the asset is priced in dollars (XAG/USD). A strong Dollar tends to keep the price of Silver at bay, whereas a weaker Dollar is likely to propel prices up. Other factors such as investment demand, mining supply – Silver is much more abundant than Gold – and recycling rates can also affect prices.
Silver is widely used in industry, particularly in sectors such as electronics or solar energy, as it has one of the highest electric conductivity of all metals – more than Copper and Gold. A surge in demand can increase prices, while a decline tends to lower them. Dynamics in the US, Chinese and Indian economies can also contribute to price swings: for the US and particularly China, their big industrial sectors use Silver in various processes; in India, consumers’ demand for the precious metal for jewellery also plays a key role in setting prices.
Silver prices tend to follow Gold's moves. When Gold prices rise, Silver typically follows suit, as their status as safe-haven assets is similar. The Gold/Silver ratio, which shows the number of ounces of Silver needed to equal the value of one ounce of Gold, may help to determine the relative valuation between both metals. Some investors may consider a high ratio as an indicator that Silver is undervalued, or Gold is overvalued. On the contrary, a low ratio might suggest that Gold is undervalued relative to Silver.
Author

Sagar Dua
FXStreet
Sagar Dua is associated with the financial markets from his college days. Along with pursuing post-graduation in Commerce in 2014, he started his markets training with chart analysis.


