Silver Price Forecast: XAG/USD surges to near $36.80 ahead of US NFP
- Silver price gains sharply to near the two-week high around $36.80 ahead of the US NFP data for June.
- The US private sector saw a reduction in the labor force in June as businesses laid-off 33K workers.
- Silver price aims to reclaim the over-a-decade-high around $37.32.

Silver price revisits two-week high near $36.80 during European trading hours on Thursday. The white metal trades firmly ahead of the United States (US) Nonfarm Payrolls (NFP) data for June, which will be published at 12:30 GMT.
The US official employment data will significantly influence market expectations for the Federal Reserve’s (Fed) monetary policy outlook as officials have lately warned of downside labor market risks.
Economists expect US employers to have added 110K fresh workers, fewer than 139K in May. The Unemployment Rate is estimated to have accelerated to 4.3% from the prior reading of 4.2%. Soft labor market data could bolster market expectations that the Fed will reduce interest rates in the policy meeting later this month.
Lower interest rates by the Fed bode well for non-yielding assets, such as Silver.
Latest US ADP Employment figures suggests that the official labor market data could be weaker. The data showed on Wednesday that the US private sector laid-off 33K employees in June, while they were expected to hire 95K fresh workers. Additionally, the May reading was also revised lower to 29K from 37K.
“Though layoffs continue to be rare, a hesitancy to hire and a reluctance to replace departing workers led to job losses last month,” Nela Richardson, chief economist at ADP, said.
On the global front, US President Donald trump has announced that his team has struck a trade agreement with Vietnam. This comes at a time when the July 9 tariff deadline is approaching.
Theoretically, improving global trade conditions diminish demand for safe-haven assets, such as Silver. However, the Silver price remains firm as the Asian country is not one of top major trading partners of the US with whom it is still negotiating bilateral deals.
Silver technical analysis
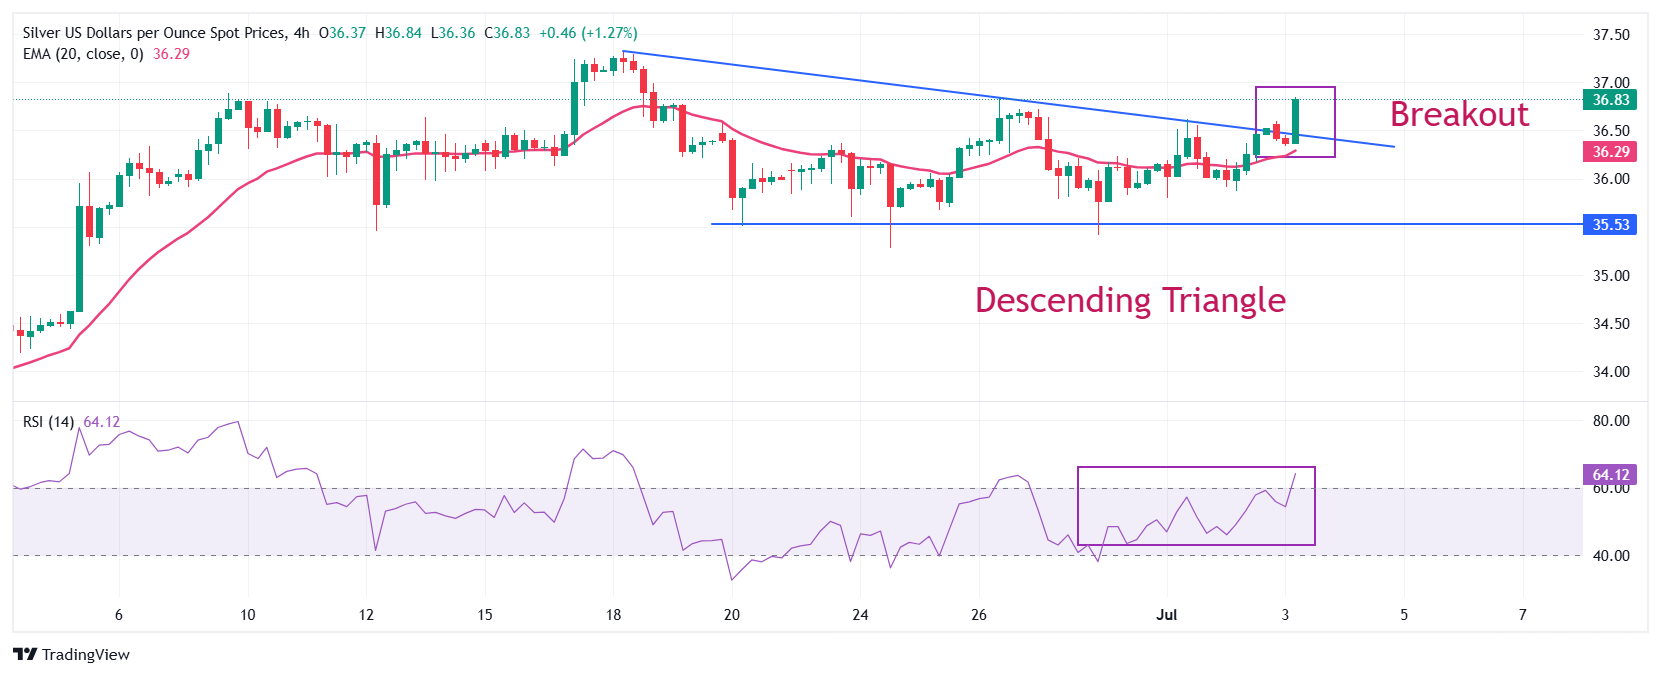
Silver price strengthens after a breakout of the Descending Triangle chart pattern formed on a four-hour time. Theoretically, the breakout of the above-mentioned chart pattern often leads to a volatility expansion, which results in higher volume and wider ticks on the upside.
The downward-sloping trendline of the Descending Triangle formation is plotted from the June 18 high of $37.32, while the horizontal support is marked from the June 20 low of $35.51.
The 14-period Relative Strength Index (RSI) breaks above 60.00. A fresh bullish momentum would trigger if the RSI holds above that level.
Looking down, the March 28 high around $34.60 will act as key support for the Silver price. On the upside, the fresh over-a-decade high around $37.32 will be the key barrier.
Silver daily chart
Silver FAQs
Silver is a precious metal highly traded among investors. It has been historically used as a store of value and a medium of exchange. Although less popular than Gold, traders may turn to Silver to diversify their investment portfolio, for its intrinsic value or as a potential hedge during high-inflation periods. Investors can buy physical Silver, in coins or in bars, or trade it through vehicles such as Exchange Traded Funds, which track its price on international markets.
Silver prices can move due to a wide range of factors. Geopolitical instability or fears of a deep recession can make Silver price escalate due to its safe-haven status, although to a lesser extent than Gold's. As a yieldless asset, Silver tends to rise with lower interest rates. Its moves also depend on how the US Dollar (USD) behaves as the asset is priced in dollars (XAG/USD). A strong Dollar tends to keep the price of Silver at bay, whereas a weaker Dollar is likely to propel prices up. Other factors such as investment demand, mining supply – Silver is much more abundant than Gold – and recycling rates can also affect prices.
Silver is widely used in industry, particularly in sectors such as electronics or solar energy, as it has one of the highest electric conductivity of all metals – more than Copper and Gold. A surge in demand can increase prices, while a decline tends to lower them. Dynamics in the US, Chinese and Indian economies can also contribute to price swings: for the US and particularly China, their big industrial sectors use Silver in various processes; in India, consumers’ demand for the precious metal for jewellery also plays a key role in setting prices.
Silver prices tend to follow Gold's moves. When Gold prices rise, Silver typically follows suit, as their status as safe-haven assets is similar. The Gold/Silver ratio, which shows the number of ounces of Silver needed to equal the value of one ounce of Gold, may help to determine the relative valuation between both metals. Some investors may consider a high ratio as an indicator that Silver is undervalued, or Gold is overvalued. On the contrary, a low ratio might suggest that Gold is undervalued relative to Silver.
Author

Sagar Dua
FXStreet
Sagar Dua is associated with the financial markets from his college days. Along with pursuing post-graduation in Commerce in 2014, he started his markets training with chart analysis.


