Silver Price Forecast: XAG/USD surges as Fed rate cut spurs rally toward $31.00
- Silver price breaks above a key resistance trendline, with a move toward $31.00 in sight after strong gains.
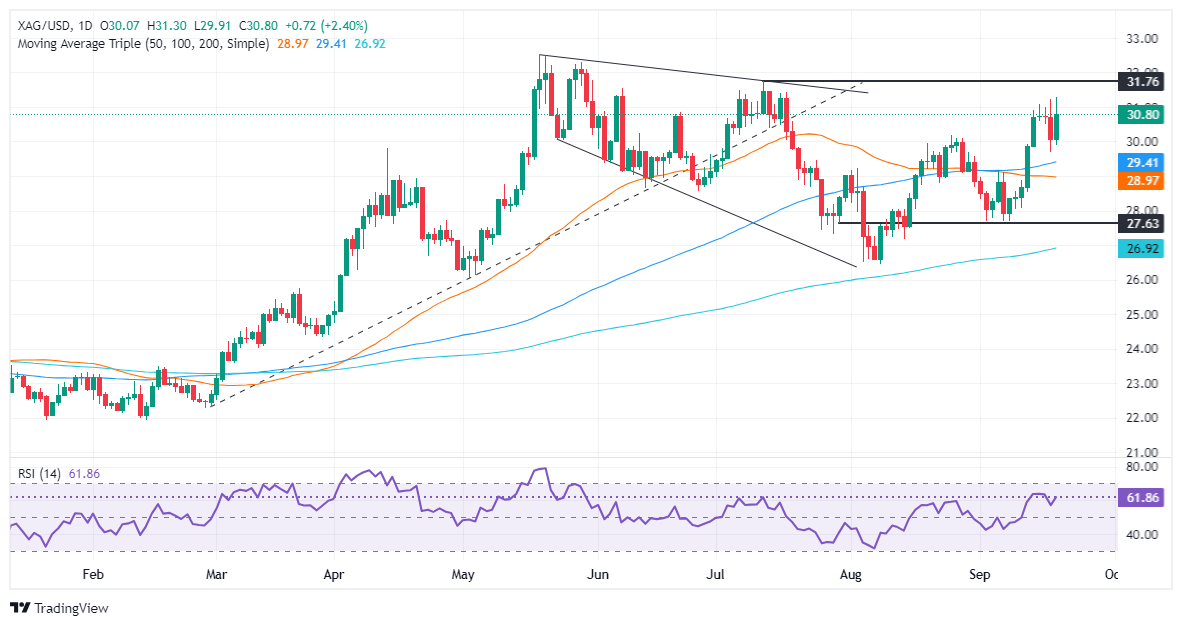
- Next resistance levels include the July 11 high at $31.75 and the May 29 peak at $32.29, with YTD high at $32.51 on the horizon.
- A bearish reversal would require a break below the September 18 low of $29.71, with further support at the 100-DMA of $29.43.

Silver climbed sharply during Thursday’s North American session, printing solid gains of over 2%, and closed at around $30.77. Investors, seeking risk and ditching the US Dollar, cheered the Federal Reserve's rate cut.
Market sentiment remains upbeat, with Wall Street's main index, the S&P 500, climbing to a record high. Meanwhile, the precious metals segment, led by Gold and Silver, surged sharply while the Greenback dropped over 0.30%, according to the US Dollar Index (DXY) at 100.63.
XAG/USD Price Forecast: Technical outlook
Silver price is threatening to decisively clear a downslope resistance trendline drawn from May 20 highs passing through $30.67. If this trendline is broken decisively, it will open the way to challenging $31.00.
In that outcome, XAG/USD next resistance will be the July 11 swing high at $31.75, followed by the May 29 peak at $32.29. On further strength, the year-to-date (YTD) high at $32.51 will be up for grabs.
Conversely, bears would need to push the grey’s metal price below the September 18 swing low of $29.71, ahead of testing the 100-day moving average (DMA) at $29.43
XAG/USD Price Action – Daily Chart
Silver FAQs
Silver is a precious metal highly traded among investors. It has been historically used as a store of value and a medium of exchange. Although less popular than Gold, traders may turn to Silver to diversify their investment portfolio, for its intrinsic value or as a potential hedge during high-inflation periods. Investors can buy physical Silver, in coins or in bars, or trade it through vehicles such as Exchange Traded Funds, which track its price on international markets.
Silver prices can move due to a wide range of factors. Geopolitical instability or fears of a deep recession can make Silver price escalate due to its safe-haven status, although to a lesser extent than Gold's. As a yieldless asset, Silver tends to rise with lower interest rates. Its moves also depend on how the US Dollar (USD) behaves as the asset is priced in dollars (XAG/USD). A strong Dollar tends to keep the price of Silver at bay, whereas a weaker Dollar is likely to propel prices up. Other factors such as investment demand, mining supply – Silver is much more abundant than Gold – and recycling rates can also affect prices.
Silver is widely used in industry, particularly in sectors such as electronics or solar energy, as it has one of the highest electric conductivity of all metals – more than Copper and Gold. A surge in demand can increase prices, while a decline tends to lower them. Dynamics in the US, Chinese and Indian economies can also contribute to price swings: for the US and particularly China, their big industrial sectors use Silver in various processes; in India, consumers’ demand for the precious metal for jewellery also plays a key role in setting prices.
Silver prices tend to follow Gold's moves. When Gold prices rise, Silver typically follows suit, as their status as safe-haven assets is similar. The Gold/Silver ratio, which shows the number of ounces of Silver needed to equal the value of one ounce of Gold, may help to determine the relative valuation between both metals. Some investors may consider a high ratio as an indicator that Silver is undervalued, or Gold is overvalued. On the contrary, a low ratio might suggest that Gold is undervalued relative to Silver.
Author

Christian Borjon Valencia
FXStreet
Markets analyst, news editor, and trading instructor with over 14 years of experience across FX, commodities, US equity indices, and global macro markets.


