Silver Price Forecast: XAG/USD surges above $41, hits 14-year high
- Silver extends rally after clearing $40.00, reaching $41.46, its highest level since September 2011.
- Markets bet on Fed delivering 25 bps cut, as labor data weakness deepens FOMC divisions ahead of September.
- RSI nears overbought territory; break above $42.00 opens path toward $43.38 and $44.22 long-term resistance.

Silver Price advances for the second consecutive day after clearing the $40.00 barrier on Tuesday, rises over 2.80% on Wednesday, trading at $41.18, after reaching a 14-year high of $41.46.
Traders bought the precious metal as they seem convinced that the latest round of economic data, particularly US jobs data, warrants a 25-basis points rate cut by the Fed at the upcoming September meeting. This, alongside a growing division amongst the Federal Open Market Committee (FOMC) board, suggests that all subsequent meetings would all be alive.
XAG/USD Price Forecast: Technical outlook
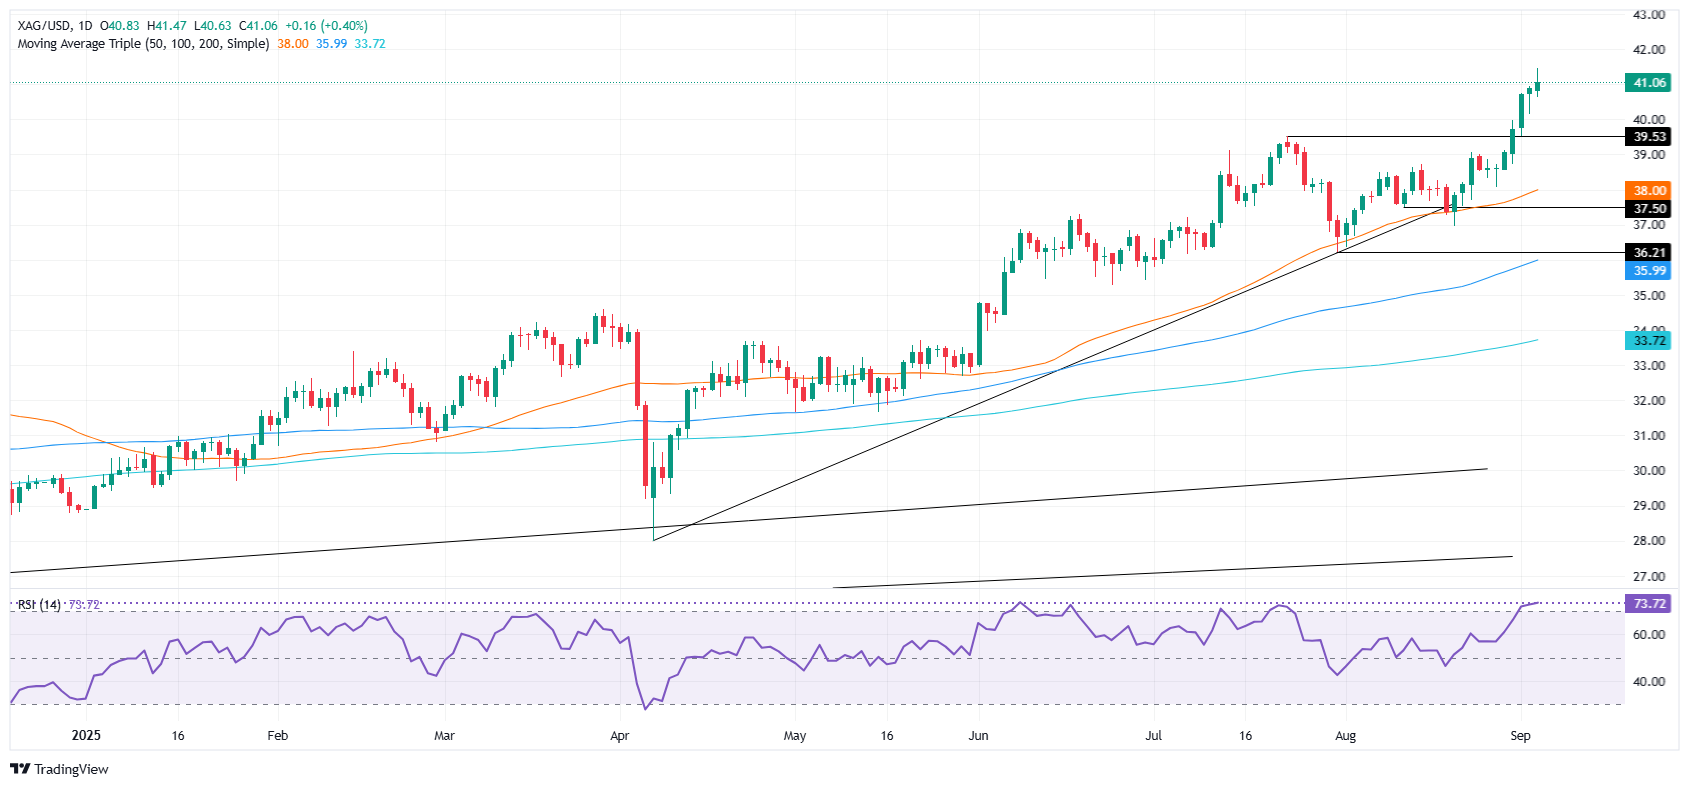
Silver rally resumed on Tuesday and extended on Wednesday, past the $41.00 figure. Although the Relative Strength Index (RSI) seems to enter overbought territory, it remains shy of cracking the 80-level seen as the most extreme overbought condition.
If XAG/USD climbs above $42.00, traders could expect a move toward the September 2011 high at $43.38. If surpassed the next stop would be August 2011 peak at $44.22.
Conversely, if Silver tumbles below $41.00, the grey metal could retrace towards the September 2 low of $40.15. A breach of the latter will expose $40.00.
XAG/USD Price Chart – Daily
Silver FAQs
Silver is a precious metal highly traded among investors. It has been historically used as a store of value and a medium of exchange. Although less popular than Gold, traders may turn to Silver to diversify their investment portfolio, for its intrinsic value or as a potential hedge during high-inflation periods. Investors can buy physical Silver, in coins or in bars, or trade it through vehicles such as Exchange Traded Funds, which track its price on international markets.
Silver prices can move due to a wide range of factors. Geopolitical instability or fears of a deep recession can make Silver price escalate due to its safe-haven status, although to a lesser extent than Gold's. As a yieldless asset, Silver tends to rise with lower interest rates. Its moves also depend on how the US Dollar (USD) behaves as the asset is priced in dollars (XAG/USD). A strong Dollar tends to keep the price of Silver at bay, whereas a weaker Dollar is likely to propel prices up. Other factors such as investment demand, mining supply – Silver is much more abundant than Gold – and recycling rates can also affect prices.
Silver is widely used in industry, particularly in sectors such as electronics or solar energy, as it has one of the highest electric conductivity of all metals – more than Copper and Gold. A surge in demand can increase prices, while a decline tends to lower them. Dynamics in the US, Chinese and Indian economies can also contribute to price swings: for the US and particularly China, their big industrial sectors use Silver in various processes; in India, consumers’ demand for the precious metal for jewellery also plays a key role in setting prices.
Silver prices tend to follow Gold's moves. When Gold prices rise, Silver typically follows suit, as their status as safe-haven assets is similar. The Gold/Silver ratio, which shows the number of ounces of Silver needed to equal the value of one ounce of Gold, may help to determine the relative valuation between both metals. Some investors may consider a high ratio as an indicator that Silver is undervalued, or Gold is overvalued. On the contrary, a low ratio might suggest that Gold is undervalued relative to Silver.
Author

Christian Borjon Valencia
FXStreet
Markets analyst, news editor, and trading instructor with over 14 years of experience across FX, commodities, US equity indices, and global macro markets.


