Silver Price Forecast: XAG/USD struggles near $29.65 area, seems poised to weaken further
- Silver struggles to gain any meaningful traction and seems vulnerable to sliding further.
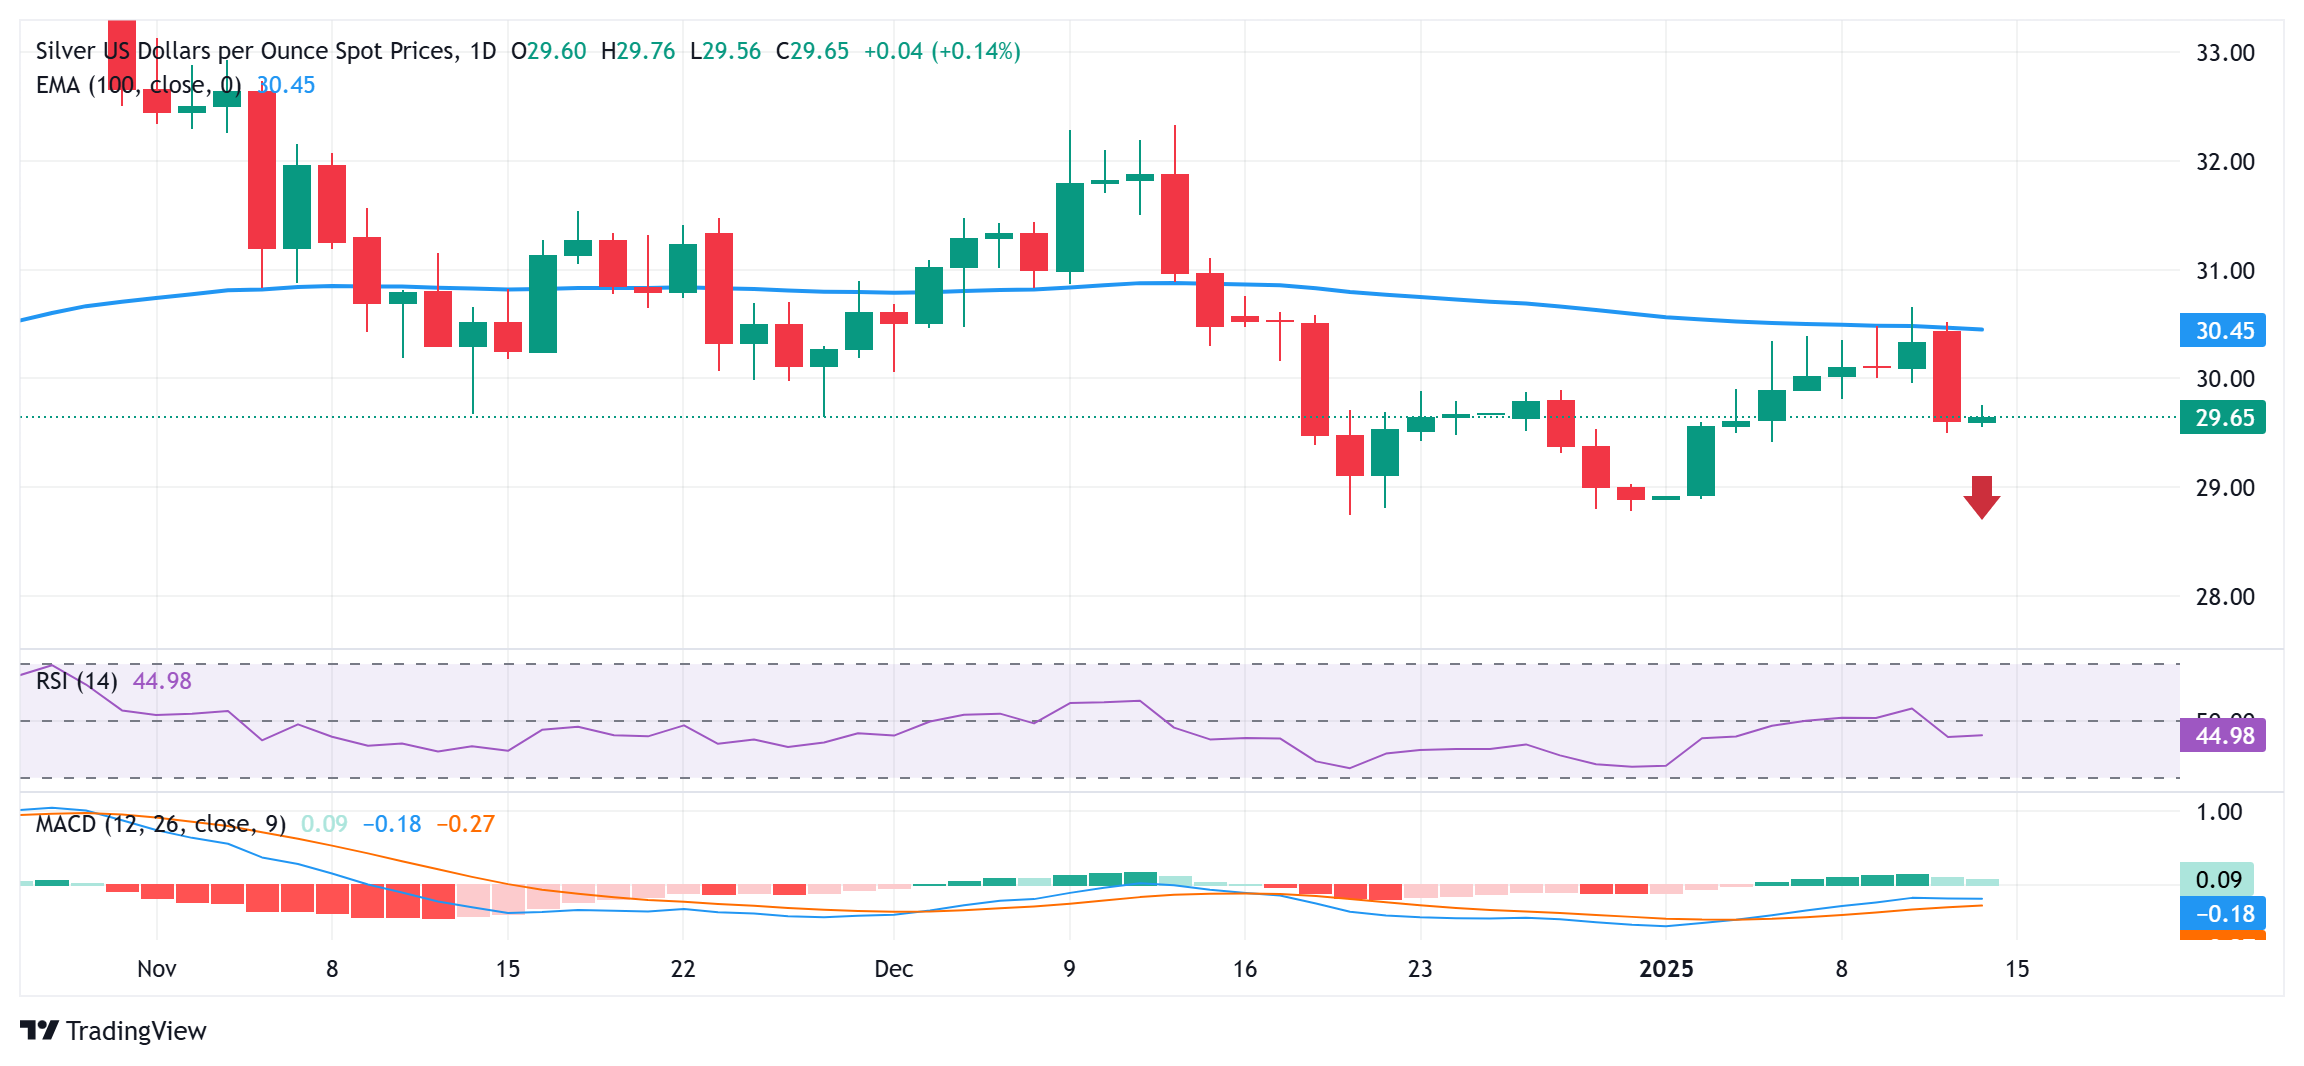
- The overnight failure near the 100-day EMA supports prospects for additional losses.
- A sustained strength beyond the $30.50-$30.55 area will negate the negative outlook.

Silver (XAG/USD) ticks higher during the Asian session on Tuesday, though it lacks bullish conviction and seems vulnerable to extending the previous day's retracement slide from the vicinity of a four-week top. The white metal currently trades around the $29.65 region, up 0.15% for the day.
From a technical perspective, Monday's failure near the 100-day Exponential Moving Average (EMA) suggests that the recent recovery from the $28.80-$28.75 region has run out of steam and validates the negative outlook. That said, mixed oscillators on the daily chart warrant some caution before placing fresh bearish bets around the XAG/USD and positioning for deeper losses.
In the meantime, the $30.00 psychological mark now seems to act as an immediate hurdle ahead of the $30.50-$30.55 region (100-day EMA). A sustained move beyond the latter might shift the near-term bias in favor of bullish traders and lift the XAG/USD beyond an intermediate resistance near the $31.00 round figure, towards the next relevant barrier near the $31.35-$31.40 zone.
On the flip side, weakness below the mid-$29.00s will reaffirm the bearish outlook and make the XAG/USD vulnerable to retest the $29.00 mark before eventually dropping to the $28.80-$28.70 region, or a three-month low touched in December. The downward trajectory could extend further towards the $28.45-$28.40 area en route to the $28.00 mark and the $27.70-$27.65 support.
XAG/USD daily chart
Silver FAQs
Silver is a precious metal highly traded among investors. It has been historically used as a store of value and a medium of exchange. Although less popular than Gold, traders may turn to Silver to diversify their investment portfolio, for its intrinsic value or as a potential hedge during high-inflation periods. Investors can buy physical Silver, in coins or in bars, or trade it through vehicles such as Exchange Traded Funds, which track its price on international markets.
Silver prices can move due to a wide range of factors. Geopolitical instability or fears of a deep recession can make Silver price escalate due to its safe-haven status, although to a lesser extent than Gold's. As a yieldless asset, Silver tends to rise with lower interest rates. Its moves also depend on how the US Dollar (USD) behaves as the asset is priced in dollars (XAG/USD). A strong Dollar tends to keep the price of Silver at bay, whereas a weaker Dollar is likely to propel prices up. Other factors such as investment demand, mining supply – Silver is much more abundant than Gold – and recycling rates can also affect prices.
Silver is widely used in industry, particularly in sectors such as electronics or solar energy, as it has one of the highest electric conductivity of all metals – more than Copper and Gold. A surge in demand can increase prices, while a decline tends to lower them. Dynamics in the US, Chinese and Indian economies can also contribute to price swings: for the US and particularly China, their big industrial sectors use Silver in various processes; in India, consumers’ demand for the precious metal for jewellery also plays a key role in setting prices.
Silver prices tend to follow Gold's moves. When Gold prices rise, Silver typically follows suit, as their status as safe-haven assets is similar. The Gold/Silver ratio, which shows the number of ounces of Silver needed to equal the value of one ounce of Gold, may help to determine the relative valuation between both metals. Some investors may consider a high ratio as an indicator that Silver is undervalued, or Gold is overvalued. On the contrary, a low ratio might suggest that Gold is undervalued relative to Silver.
Author

Haresh Menghani
FXStreet
Haresh Menghani is a detail-oriented professional with 10+ years of extensive experience in analysing the global financial markets.


