Silver Price Forecast: XAG/USD struggles at $24.00, bears eye $23.50
- Silver is steady seesawing around $23.75, waiting for a catalyst.
- Mixed market sentiment, but slightly downbeat, triggered by the Chinese economy’s deceleration.
- XAG/USD daily and hourly charts support a bearish bias in the white metal.
Earlier in the New York session, XAG/USD reached a high of $23.91 but, as the New York stock market opened, the white metal retreated the move trading at $23.79 down a decent 0.27% at the time of writing.
The market sentiment remains mixed but slightly downbeat. During the Asian session, data showed that the Chinese economy keeps slowing down. China’s Retail Sales edged higher by 2.5% versus 7% forecasted by analysts. It was a huge miss caused by lockdown measures implemented in the country amid a Delta variant outbreak. Additionally, major European stock indices finished with losses in line with Asian markets, weighed by Chinese data, while three out of four US stock indexes post gains between 0.37% and 0.40%.
Technical outlook
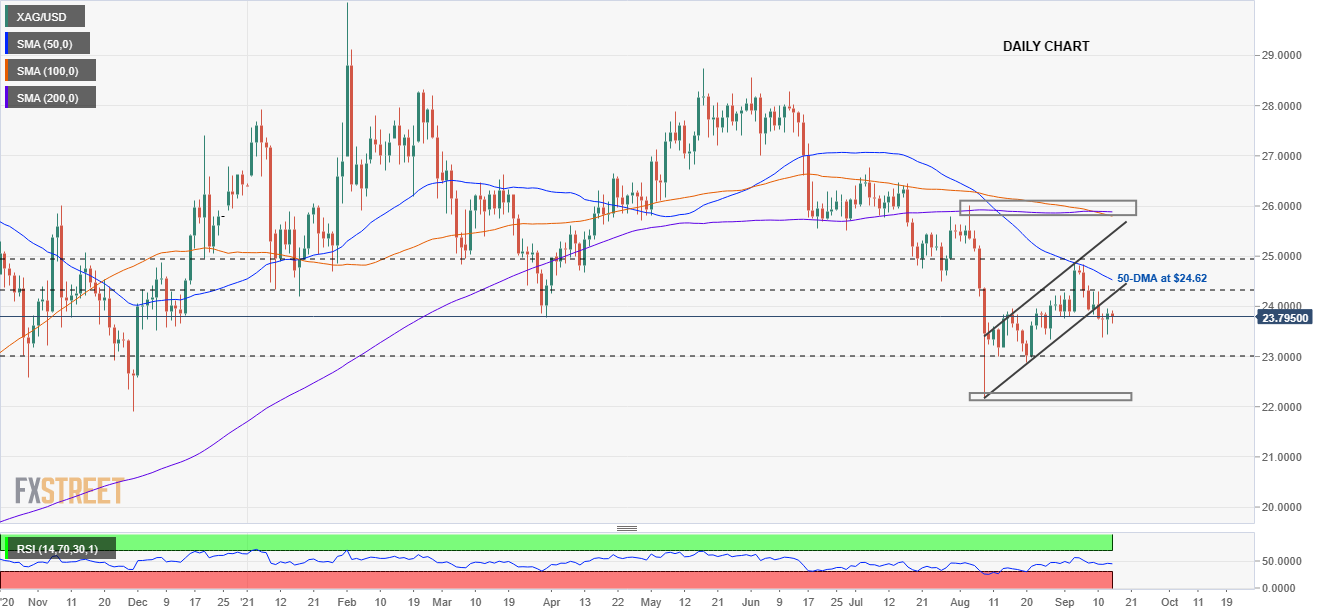
Daily chart
XAG/USD is still trading beneath the bottom-trendline of a bearish flag, keeping the downtrend intact. Moreover, the daily moving averages are above the spot price, putting a lid around $24.00. Nevertheless, silver has been trading within the $23.37-96 range in the last three sessions. A daily break below $23.37 will open the door for further losses, towards 2021 low, around $22.10.
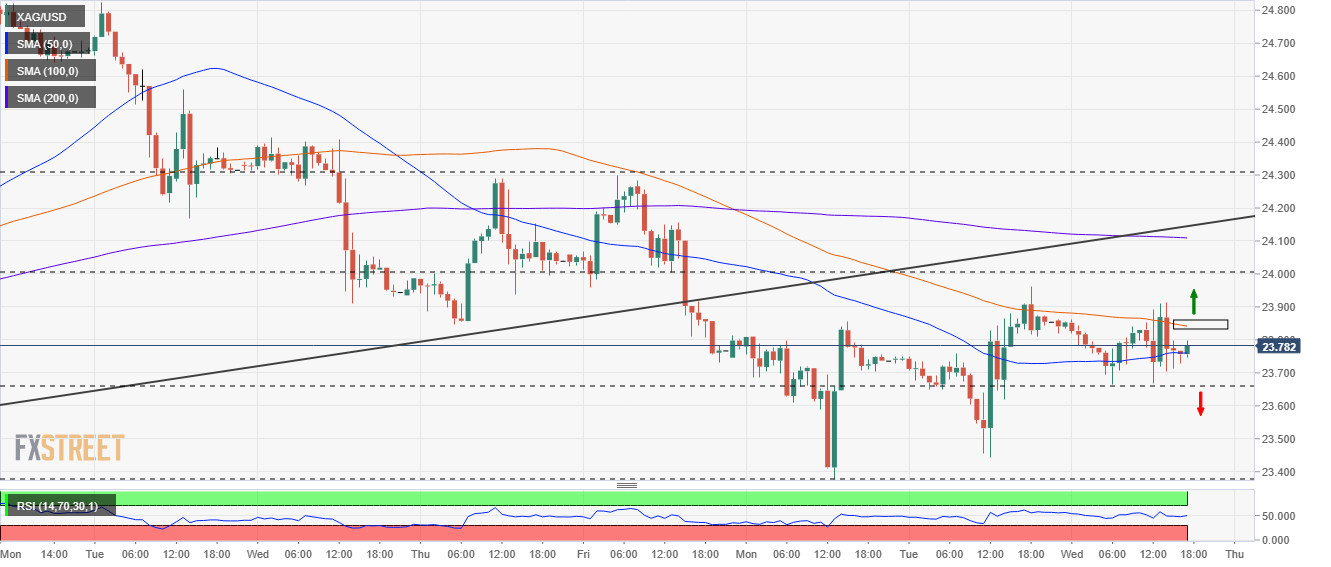
1-hour chart
Zooming into the 1-hour chart, XAG/USD is trading between the 100 and the 50-simple moving average (SMA), lying at $23.84 and $23.76, respectively. The longer one, the 200-SMA is up at $24.10, confirming the bearish bias. A break below $23.66 could push the prices towards the September 13 lows around $23.37. A sustained break of that support level will pave the way towards August 20 swing lows around $22.87.
On the flip side, a break above the 100-SMA will push the price towards a key resistance area around $24.00 topped by the 200-SMA at $24.10.
Author

Christian Borjon Valencia
FXStreet
Markets analyst, news editor, and trading instructor with over 14 years of experience across FX, commodities, US equity indices, and global macro markets.


