- XAG/USD is steady as the US 10-year T-bond yield sits firmly around 1.61%.
- The US Dollar Index seems poised to close above 94.00 for the second consecutive week.
Silver (XAG/USD) is advancing during the New York session, climbs 0.69%, trading at $22.76 at the time of writing. Price action throughout the American session has been swinging violently after the US Bureau of Labor Statistics (BLS) released the US Nonfarm Payrolls report, which revealed an increase of just 194K jobs, lower than the 500K foreseen by analysts.
The employment figure shows that there is slack left in the labor market, although the positive is that the Unemployment Rate fell from 5.1% to 4.8%. Furthermore, investors’ reaction seems to align with what Federal Reserve Chairman Jerome Powell said at the September meeting. He said that he needed a reasonably good jobs report to begin the bond tapering process.
The risk-off appetite portrayed the market reaction. US stock indices, instead of climbing, fell, the US T-bond 10-year yield rose to 1.61%, and the US dollar clung to 94.11, lost 0.11% against a basket of six peers.
XAG/USD Price Forecast: Technical outlook
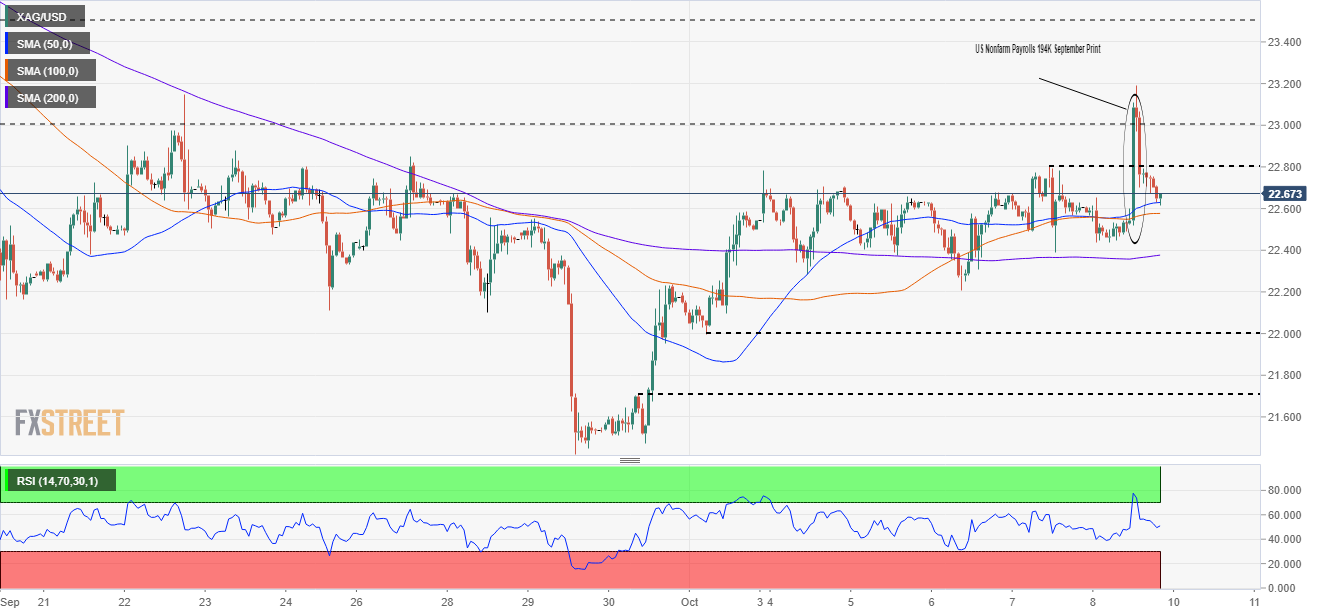
1-hour chart
XAG/USD is trading above the simple moving averages, suggesting that silver has an upside bias.
The price action once the Nonfarm Payrolls figure for September hit the wires, silver jumped aggressively towards the new daily high around $23.19, but as the report was dissected, the knee-jerk reaction faded, retreating towards familiar levels around the 50-SMA at $22.63
For silver buyers to resume the uptrend, they will need to break above $23.00. in case of that outcome, the first supply zone would be the high of October 8 at $23.19. A break of the latter would expose the September 14 swing lows around $23.50, followed by the psychological $24.00.
On the other hand, for XAG/USD sellers to regain control, they need to reclaim the 200-SMA at $22.36. Once that has been achieved, a fall towards 2021 lows of around $21.40 is on the cards. Nevertheless, there would be some crucial demand zones in the way, like the psychological round number $22.00, followed by $21.79.
The Relative Strength Index (RSI) is at 50, aiming slightly high, suggesting upside bias in the short-term, which could open the door for another leg up.
Information on these pages contains forward-looking statements that involve risks and uncertainties. Markets and instruments profiled on this page are for informational purposes only and should not in any way come across as a recommendation to buy or sell in these assets. You should do your own thorough research before making any investment decisions. FXStreet does not in any way guarantee that this information is free from mistakes, errors, or material misstatements. It also does not guarantee that this information is of a timely nature. Investing in Open Markets involves a great deal of risk, including the loss of all or a portion of your investment, as well as emotional distress. All risks, losses and costs associated with investing, including total loss of principal, are your responsibility. The views and opinions expressed in this article are those of the authors and do not necessarily reflect the official policy or position of FXStreet nor its advertisers. The author will not be held responsible for information that is found at the end of links posted on this page.
If not otherwise explicitly mentioned in the body of the article, at the time of writing, the author has no position in any stock mentioned in this article and no business relationship with any company mentioned. The author has not received compensation for writing this article, other than from FXStreet.
FXStreet and the author do not provide personalized recommendations. The author makes no representations as to the accuracy, completeness, or suitability of this information. FXStreet and the author will not be liable for any errors, omissions or any losses, injuries or damages arising from this information and its display or use. Errors and omissions excepted.
The author and FXStreet are not registered investment advisors and nothing in this article is intended to be investment advice.
Recommended content
Editors’ Picks
EUR/USD steady below 1.0800 after US PCE meets expectations
EUR/USD remains depressed below 1.0800 after soft French inflation data, amid minimal volatility and thin liquidity on Good Friday. The pair barely reacted to US PCE inflation data, with the Greenback shedding some pips. Fed Chair Jerome Powell set to speak ahead of the weekly close.
GBP/USD hovers around 1.2620 in dull trading
GBP/USD trades sideways above 1.2600 amid a widespread holiday restraining action across financial markets. Investors took a long weekend ahead of critical United States employment data next week. Fed Chair Powell coming up next.
Gold price sits at all-time highs above $2,230
Gold price holds near a fresh all-time high at $2,236 in thinned trading amid the Easter Holiday. Most major world markets remain closed, although the United States published core PCE inflation, the Federal Reserve’s favorite inflation gauge.
Jito price could hit $6 as JTO coils up inside this bullish pattern
Jito (JTO) price has been on an uptrend since forming a local bottom in early January. Since then, JTO has revisited the key swing point formed in early December, suggesting the bulls’ intention to move higher.
Key events in developed markets next week
Next week, the main focus will be inflation and the labour market in the Eurozone. We expect services inflation to be impacted by the easter effect, while the unemployment rate to be unchanged.