Silver Price Forecast: XAG/USD slides below $33.00; 200-period EMA on H4 holds the key for bulls
- Silver attracts some intraday sellers and turns lower for the second straight day.
- The setup seems tilted in favor of bears and supports prospects for further losses.
- A sustained strength beyond the $33.70 hurdle would negate the negative bias.

Silver (XAG/USD) struggles to capitalize on a modest Asian session uptick and slides back below the $33.00 mark, hitting a fresh daily low in the last hour.
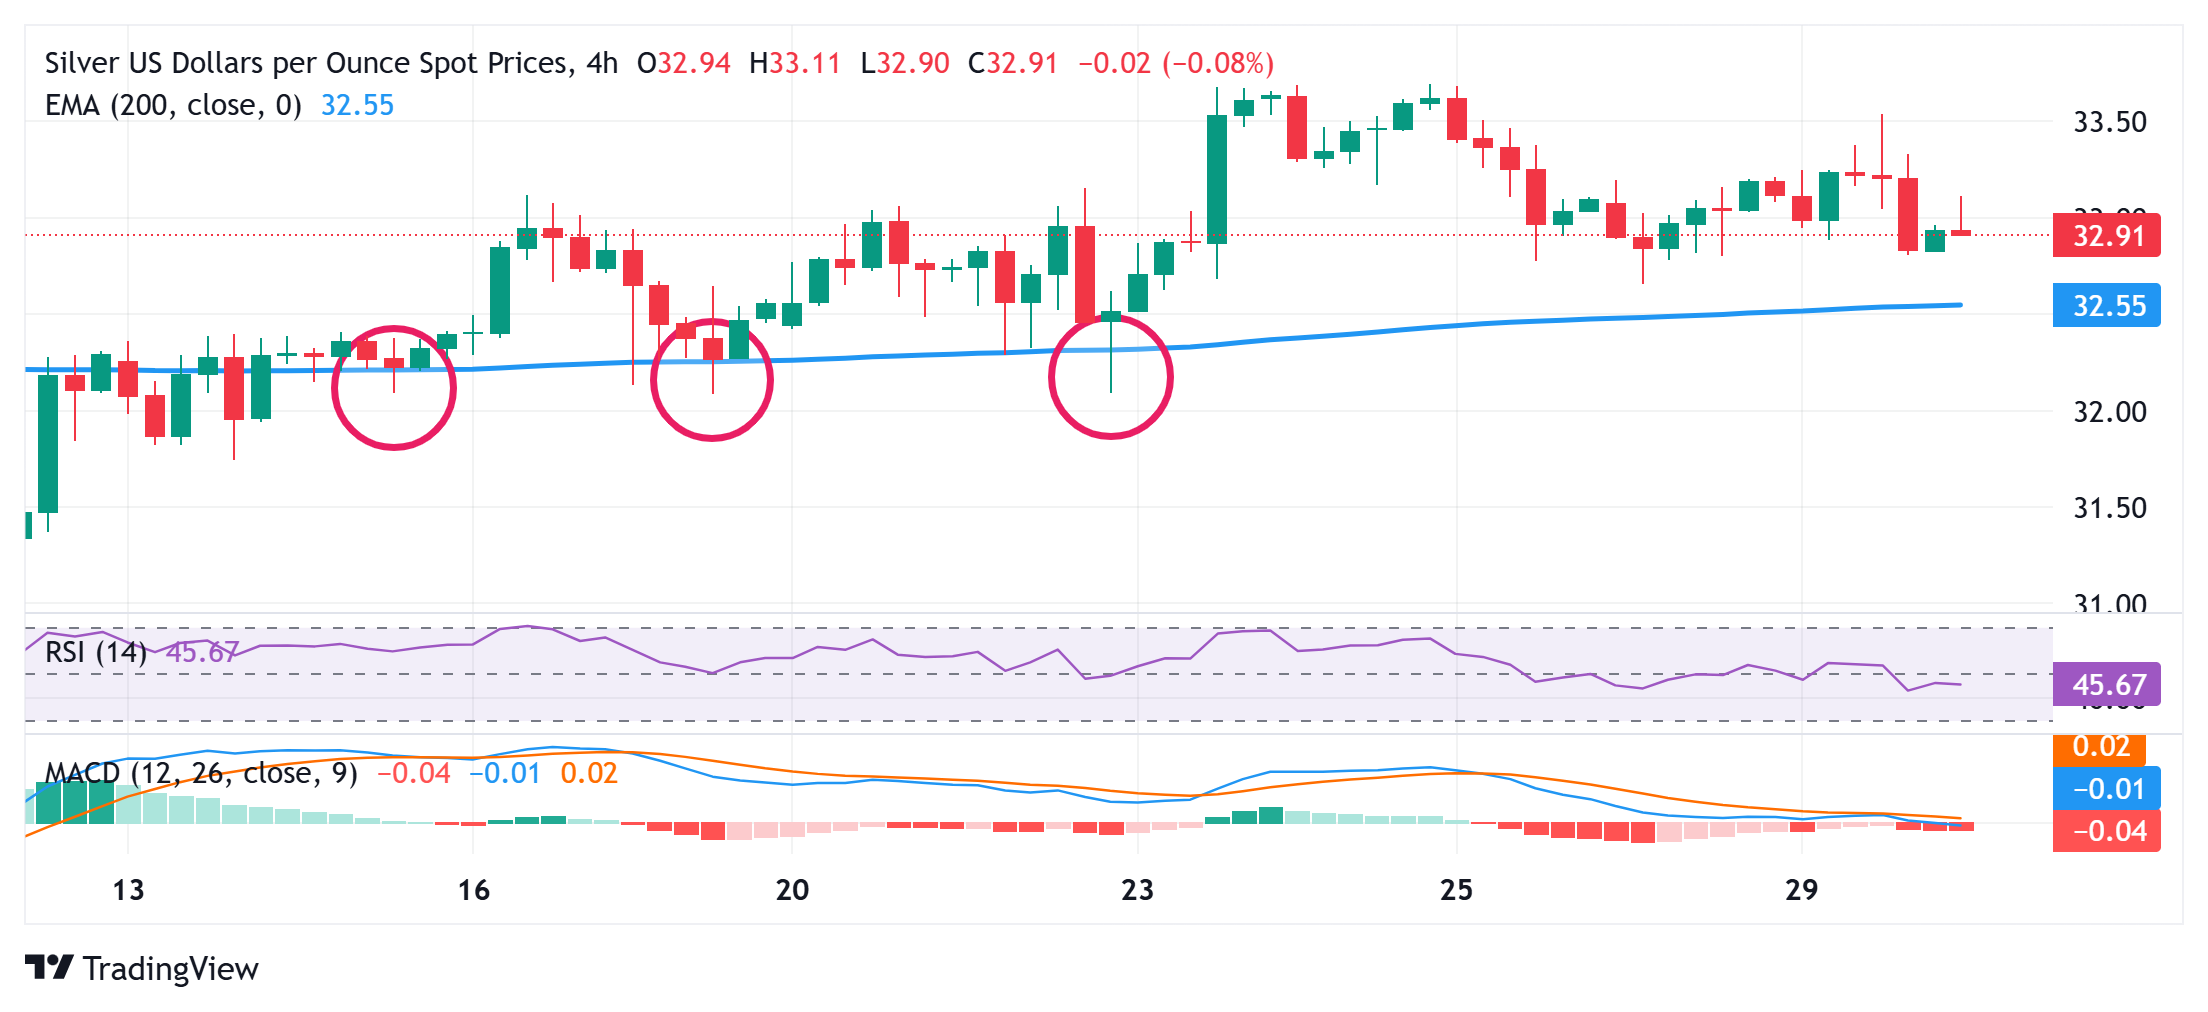
From a technical perspective, the XAG/USD has been showing resilience below the 200-period Exponential Moving Average (EMA) on the 4-hour chart, which is currently pegged near the $32.60 region. The said area should act as a key pivotal point. Given that oscillators on the daily chart have been losing traction and are holding in negative territory on the 4-hour chart, a convincing break below will be seen as a fresh trigger for bearish traders.
The XAG/USD might then accelerate the slide towards the next relevant support near the $32.10-$32.00 region. Some follow-through selling will suggest that the recent recovery from the $28.00 mark, or the year-to-date low, has run out of steam and pave the way for deeper losses. The subsequent fall could drag the white metal to the $31.70 intermediate support en route to the $31.55-$31.50 region and eventually to sub-$31.00 levels, or the 200-day SMA.
On the flip side, any positive move beyond the $33.20 immediate hurdle could attract some sellers near the $31.55 region and remain capped near the $33.70 barrier. A sustained strength beyond the latter should allow the XAG/USD to reclaim the $34.00 mark and climb to the $34.30 resistance. The white metal might then test the $34.55-$34.60 resistance, or the highest level since October 2024 touched last month, before aiming to conquer the $35.00 psychological mark.
Silver 4-hour chart
Silver FAQs
Silver is a precious metal highly traded among investors. It has been historically used as a store of value and a medium of exchange. Although less popular than Gold, traders may turn to Silver to diversify their investment portfolio, for its intrinsic value or as a potential hedge during high-inflation periods. Investors can buy physical Silver, in coins or in bars, or trade it through vehicles such as Exchange Traded Funds, which track its price on international markets.
Silver prices can move due to a wide range of factors. Geopolitical instability or fears of a deep recession can make Silver price escalate due to its safe-haven status, although to a lesser extent than Gold's. As a yieldless asset, Silver tends to rise with lower interest rates. Its moves also depend on how the US Dollar (USD) behaves as the asset is priced in dollars (XAG/USD). A strong Dollar tends to keep the price of Silver at bay, whereas a weaker Dollar is likely to propel prices up. Other factors such as investment demand, mining supply – Silver is much more abundant than Gold – and recycling rates can also affect prices.
Silver is widely used in industry, particularly in sectors such as electronics or solar energy, as it has one of the highest electric conductivity of all metals – more than Copper and Gold. A surge in demand can increase prices, while a decline tends to lower them. Dynamics in the US, Chinese and Indian economies can also contribute to price swings: for the US and particularly China, their big industrial sectors use Silver in various processes; in India, consumers’ demand for the precious metal for jewellery also plays a key role in setting prices.
Silver prices tend to follow Gold's moves. When Gold prices rise, Silver typically follows suit, as their status as safe-haven assets is similar. The Gold/Silver ratio, which shows the number of ounces of Silver needed to equal the value of one ounce of Gold, may help to determine the relative valuation between both metals. Some investors may consider a high ratio as an indicator that Silver is undervalued, or Gold is overvalued. On the contrary, a low ratio might suggest that Gold is undervalued relative to Silver.
Author

Haresh Menghani
FXStreet
Haresh Menghani is a detail-oriented professional with 10+ years of extensive experience in analysing the global financial markets.


