Silver Price Forecast: XAG/USD shines and climbs above 100-day SMA
- Silver posts a 1.33% gain on Friday, yet records a weekly loss of 2.30%.
- Technical outlook neutral with a potential bullish pivot if Silver clears $31.00 resistance.
- Downward risk persists if Silver falls below $30.35, targeting next support at $30.00.

Silver price advanced on Friday and finished the session with gains of over 1.33%, yet printed losses of 2.30% in the week. A weak US Dollar sponsored a leg up in the grey metal, which has cleared the 100-day Simple Moving Average (SMA) of $30.35. At the time of writing, the XAG/USD trades at $30.60.
XAG/USD Price Forecast: Technical outlook
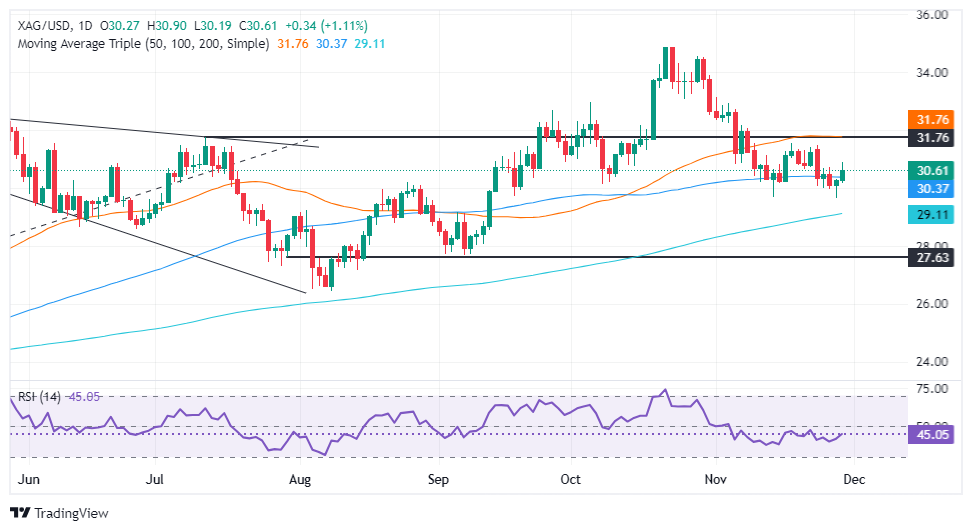
The grey metal is neutral to downward biased, consolidated, and fluctuated around the 100-day SMA. Neither buyers nor sellers have been able to move Silver’s price outside of the $29.64-$31.52 range.
Oscillators such as the Relative Strength Index (RSI) remain bearish, though there have been signs that buyers are gathering steam.
Hence, for a bullish continuation, buyers must clear the $31.00. Once cleared, the next stop would be the top of the range at $31.52 before buyers could target the 50-day SMA at $31.74, ahead of the $32.00 figure.
On the other hand, if XAG/USD drops below the 100-day SMA of $30.35, the next support would be the $30.00 mark. On further weakness, sellers could aim to the 200-day SMA at $29.10.
XAG/USD Price Chart – Daily
Silver FAQs
Silver is a precious metal highly traded among investors. It has been historically used as a store of value and a medium of exchange. Although less popular than Gold, traders may turn to Silver to diversify their investment portfolio, for its intrinsic value or as a potential hedge during high-inflation periods. Investors can buy physical Silver, in coins or in bars, or trade it through vehicles such as Exchange Traded Funds, which track its price on international markets.
Silver prices can move due to a wide range of factors. Geopolitical instability or fears of a deep recession can make Silver price escalate due to its safe-haven status, although to a lesser extent than Gold's. As a yieldless asset, Silver tends to rise with lower interest rates. Its moves also depend on how the US Dollar (USD) behaves as the asset is priced in dollars (XAG/USD). A strong Dollar tends to keep the price of Silver at bay, whereas a weaker Dollar is likely to propel prices up. Other factors such as investment demand, mining supply – Silver is much more abundant than Gold – and recycling rates can also affect prices.
Silver is widely used in industry, particularly in sectors such as electronics or solar energy, as it has one of the highest electric conductivity of all metals – more than Copper and Gold. A surge in demand can increase prices, while a decline tends to lower them. Dynamics in the US, Chinese and Indian economies can also contribute to price swings: for the US and particularly China, their big industrial sectors use Silver in various processes; in India, consumers’ demand for the precious metal for jewellery also plays a key role in setting prices.
Silver prices tend to follow Gold's moves. When Gold prices rise, Silver typically follows suit, as their status as safe-haven assets is similar. The Gold/Silver ratio, which shows the number of ounces of Silver needed to equal the value of one ounce of Gold, may help to determine the relative valuation between both metals. Some investors may consider a high ratio as an indicator that Silver is undervalued, or Gold is overvalued. On the contrary, a low ratio might suggest that Gold is undervalued relative to Silver.
Author

Christian Borjon Valencia
FXStreet
Markets analyst, news editor, and trading instructor with over 14 years of experience across FX, commodities, US equity indices, and global macro markets.


