Silver Price Forecast: XAG/USD seems poised to climb further while above $33.00 confluence
- Silver regains positive traction and looks to build on recovery from a two-week low set last Friday.
- The recent repeated failure to find bearish acceptance below $33.00 validates the positive outlook.
- Weakness below the 100-period SMA on the 4-hour chart might shift the bias in favor of bears.

Silver (XAG/USD) attracts fresh buyers following the previous day's flat closing and builds on the steady intraday ascent through the first half of the European session on Tuesday. The white metal currently trades around the $33.35 region, up 0.80% for the day, and looks to build on its modest bounce from a nearly two-week low touched last Friday.
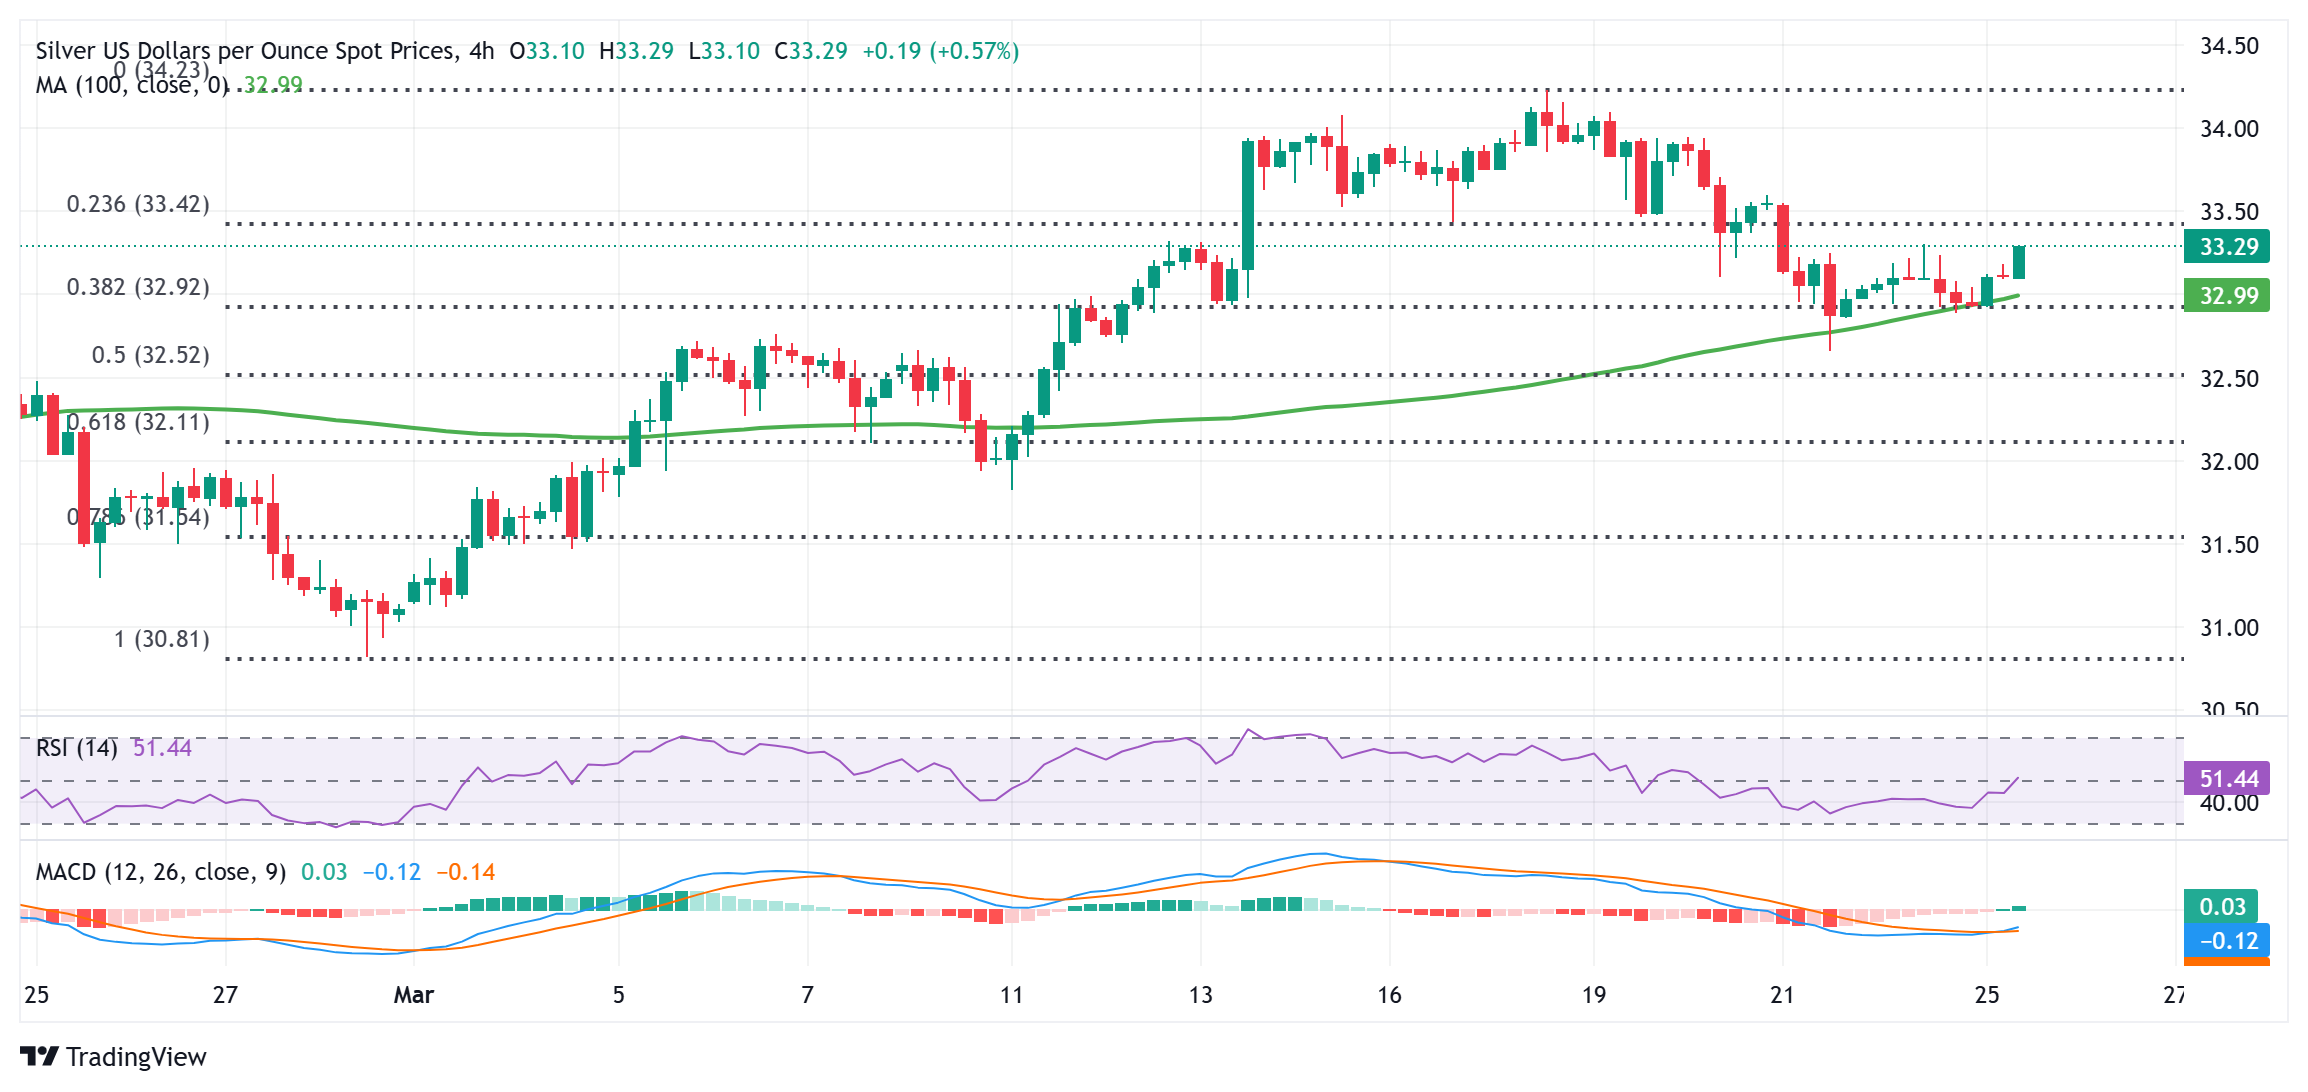
From a technical perspective, the XAG/USD has been showing resilience below the 38.2% Fibonacci retracement level of the move-up from the late February low and the $33.00 mark. The latter now coincides with the 100-period Simple Moving Average (SMA) on the 4-hour chart and should act as a key pivotal point. Given that oscillators on the daily chart are holding in positive territory, the near-term bias seems tilted in favor of bulls and supports prospects for further appreciation.
Hence, a subsequent strength towards the $33.40 region, or the 23.6% Fibo. level, en route to the next relevant hurdle near the $33.60 area, looks like a distinct possibility. Some follow-through buying should allow the XAG/USD to reclaim the $34.00 round-figure mark and climb further towards testing a multi-month high, around the $34.20-$34.25 region touched on March 18.
Meanwhile, a convincing break and acceptance below the $33.00 mark could shift the near-term bias in favor of bearish traders. The XAG/USD might then weaken further below last week's swing low, around the $32.65 region and the $30.50 area or the 50% Fibo. level, towards testing the $32.00 round figure. This is followed by supports near the $31.80 zone (March 11 low), which if broken might shift the bias in favor of bearish traders and expose the monthly swing low, around the $31.10 region.
XAG/USD 4-hour chart
Silver FAQs
Silver is a precious metal highly traded among investors. It has been historically used as a store of value and a medium of exchange. Although less popular than Gold, traders may turn to Silver to diversify their investment portfolio, for its intrinsic value or as a potential hedge during high-inflation periods. Investors can buy physical Silver, in coins or in bars, or trade it through vehicles such as Exchange Traded Funds, which track its price on international markets.
Silver prices can move due to a wide range of factors. Geopolitical instability or fears of a deep recession can make Silver price escalate due to its safe-haven status, although to a lesser extent than Gold's. As a yieldless asset, Silver tends to rise with lower interest rates. Its moves also depend on how the US Dollar (USD) behaves as the asset is priced in dollars (XAG/USD). A strong Dollar tends to keep the price of Silver at bay, whereas a weaker Dollar is likely to propel prices up. Other factors such as investment demand, mining supply – Silver is much more abundant than Gold – and recycling rates can also affect prices.
Silver is widely used in industry, particularly in sectors such as electronics or solar energy, as it has one of the highest electric conductivity of all metals – more than Copper and Gold. A surge in demand can increase prices, while a decline tends to lower them. Dynamics in the US, Chinese and Indian economies can also contribute to price swings: for the US and particularly China, their big industrial sectors use Silver in various processes; in India, consumers’ demand for the precious metal for jewellery also plays a key role in setting prices.
Silver prices tend to follow Gold's moves. When Gold prices rise, Silver typically follows suit, as their status as safe-haven assets is similar. The Gold/Silver ratio, which shows the number of ounces of Silver needed to equal the value of one ounce of Gold, may help to determine the relative valuation between both metals. Some investors may consider a high ratio as an indicator that Silver is undervalued, or Gold is overvalued. On the contrary, a low ratio might suggest that Gold is undervalued relative to Silver.
Author

Haresh Menghani
FXStreet
Haresh Menghani is a detail-oriented professional with 10+ years of extensive experience in analysing the global financial markets.


