Silver Price Forecast: XAG/USD recovery stalls below $48,00
- Silver's recovery attempt is losing momentum ahead of the $48,00 level
- The precious metals remain weighed by a firm US Dollar.
- Technically, XAG/USD remains trading sideways between $45.85 and $49.35.

Silver (XAG/USD) is posting a frail recovery on Wednesday, trimming losses after a three-day reversal. The pair bounced from $46.90 lows on Tuesday, with precious metals favoured by the risk-averse sentiment, although bulls lack momentum as price action nears the 48.00 area.
The relatively high US Treasury yields and a firm US Dollar, with the USD Index steady at three-month highs above the 100.00 psychological level, are weighing on Silver. Investors are wary of selling the US Dollar, ahead of the releases of the US ADP Employment Report and the US ISM Services PMI for further insight into the Federal Reserve's near-term decisions.
Technical analysis: Looking for direction around $48.00
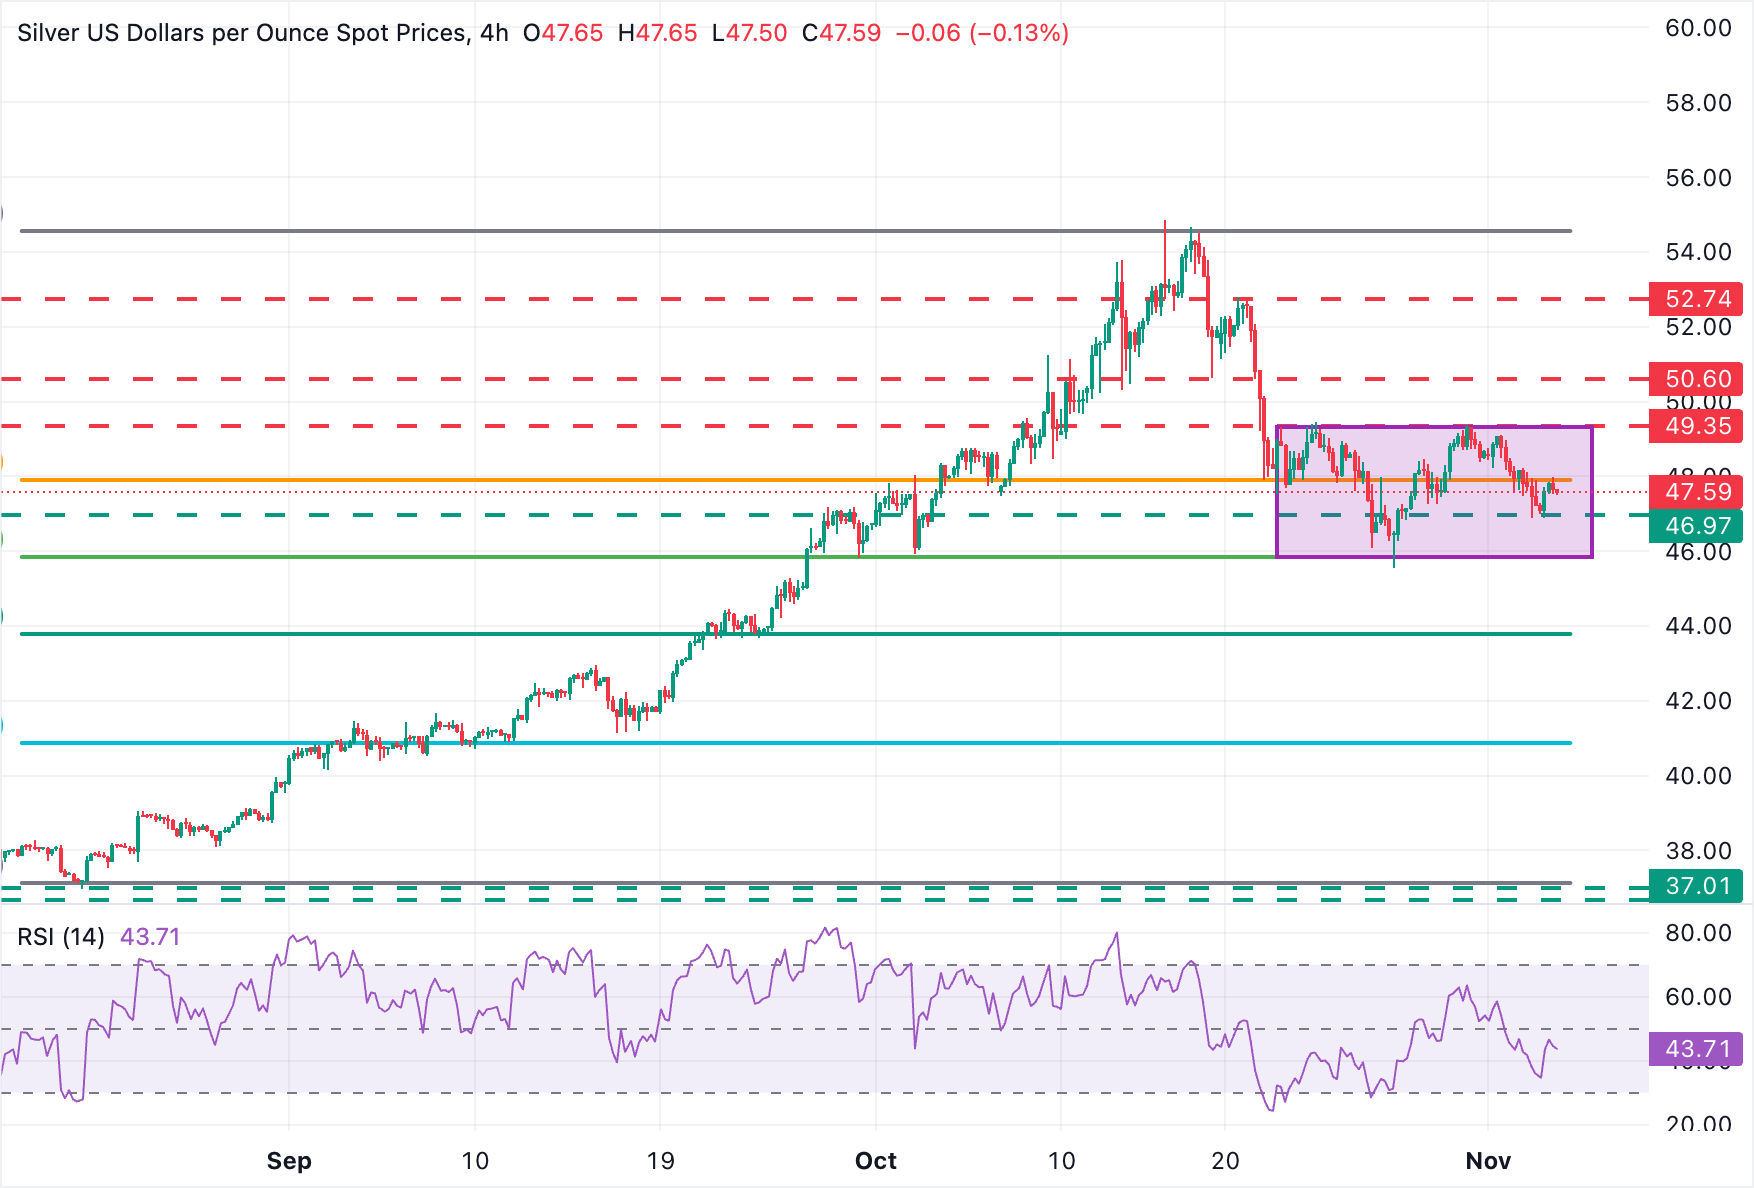
From a technical standpoint, Silver is trading halfway through the last two weeks' range, as the corrective reversal from long-term highs at $54.86 found support around the 50% Fibonacci retracement of the August - October rally, at the $45.85 area. The pair has been bouncing between that level and $49.35 ever since.
To the upside, a confirmation below the mentioned $49.35 level (October 23, 31 highs), might find resistance at a previous support in the area of $50.40-50.60, where bears were contained on October 13 and 17. Further up the target would be the October 20 high, near 59.80.
Immediate support is at Tuesday's low near $47.00, ahead of the mentioned $45.85 area (October 28 low). A confirmation below here would provide a further impulse for bears to target the 61.8% Fibonacci retracement of the previously mentioned cycle, and the September 24 low, at $43.80.
Silver FAQs
Silver is a precious metal highly traded among investors. It has been historically used as a store of value and a medium of exchange. Although less popular than Gold, traders may turn to Silver to diversify their investment portfolio, for its intrinsic value or as a potential hedge during high-inflation periods. Investors can buy physical Silver, in coins or in bars, or trade it through vehicles such as Exchange Traded Funds, which track its price on international markets.
Silver prices can move due to a wide range of factors. Geopolitical instability or fears of a deep recession can make Silver price escalate due to its safe-haven status, although to a lesser extent than Gold's. As a yieldless asset, Silver tends to rise with lower interest rates. Its moves also depend on how the US Dollar (USD) behaves as the asset is priced in dollars (XAG/USD). A strong Dollar tends to keep the price of Silver at bay, whereas a weaker Dollar is likely to propel prices up. Other factors such as investment demand, mining supply – Silver is much more abundant than Gold – and recycling rates can also affect prices.
Silver is widely used in industry, particularly in sectors such as electronics or solar energy, as it has one of the highest electric conductivity of all metals – more than Copper and Gold. A surge in demand can increase prices, while a decline tends to lower them. Dynamics in the US, Chinese and Indian economies can also contribute to price swings: for the US and particularly China, their big industrial sectors use Silver in various processes; in India, consumers’ demand for the precious metal for jewellery also plays a key role in setting prices.
Silver prices tend to follow Gold's moves. When Gold prices rise, Silver typically follows suit, as their status as safe-haven assets is similar. The Gold/Silver ratio, which shows the number of ounces of Silver needed to equal the value of one ounce of Gold, may help to determine the relative valuation between both metals. Some investors may consider a high ratio as an indicator that Silver is undervalued, or Gold is overvalued. On the contrary, a low ratio might suggest that Gold is undervalued relative to Silver.
Author

Guillermo Alcala
FXStreet
Graduated in Communication Sciences at the Universidad del Pais Vasco and Universiteit van Amsterdam, Guillermo has been working as financial news editor and copywriter in diverse Forex-related firms, like FXStreet and Kantox.


