Silver Price Forecast: XAG/USD recovers further to $47.50; not out of the woods yet
- Silver attracts buyers on Wednesday and moves away from an over one-month low.
- The mixed technical setup warrants caution before positioning for any further gains.
- Bears need to wait for a break below the $45.55 confluence before placing fresh bets.

Silver (XAG/USD) is trading with a positive bias during the Asian session on Wednesday and looking to build on the overnight bounce from the vicinity of mid-$45.00s, or the lowest level since September 25. The white metal hovers around the $47.45-47.50 area, up 0.80% for the day, though the uptick lacks bullish conviction ahead of the highly-anticipated FOMC rate decision.
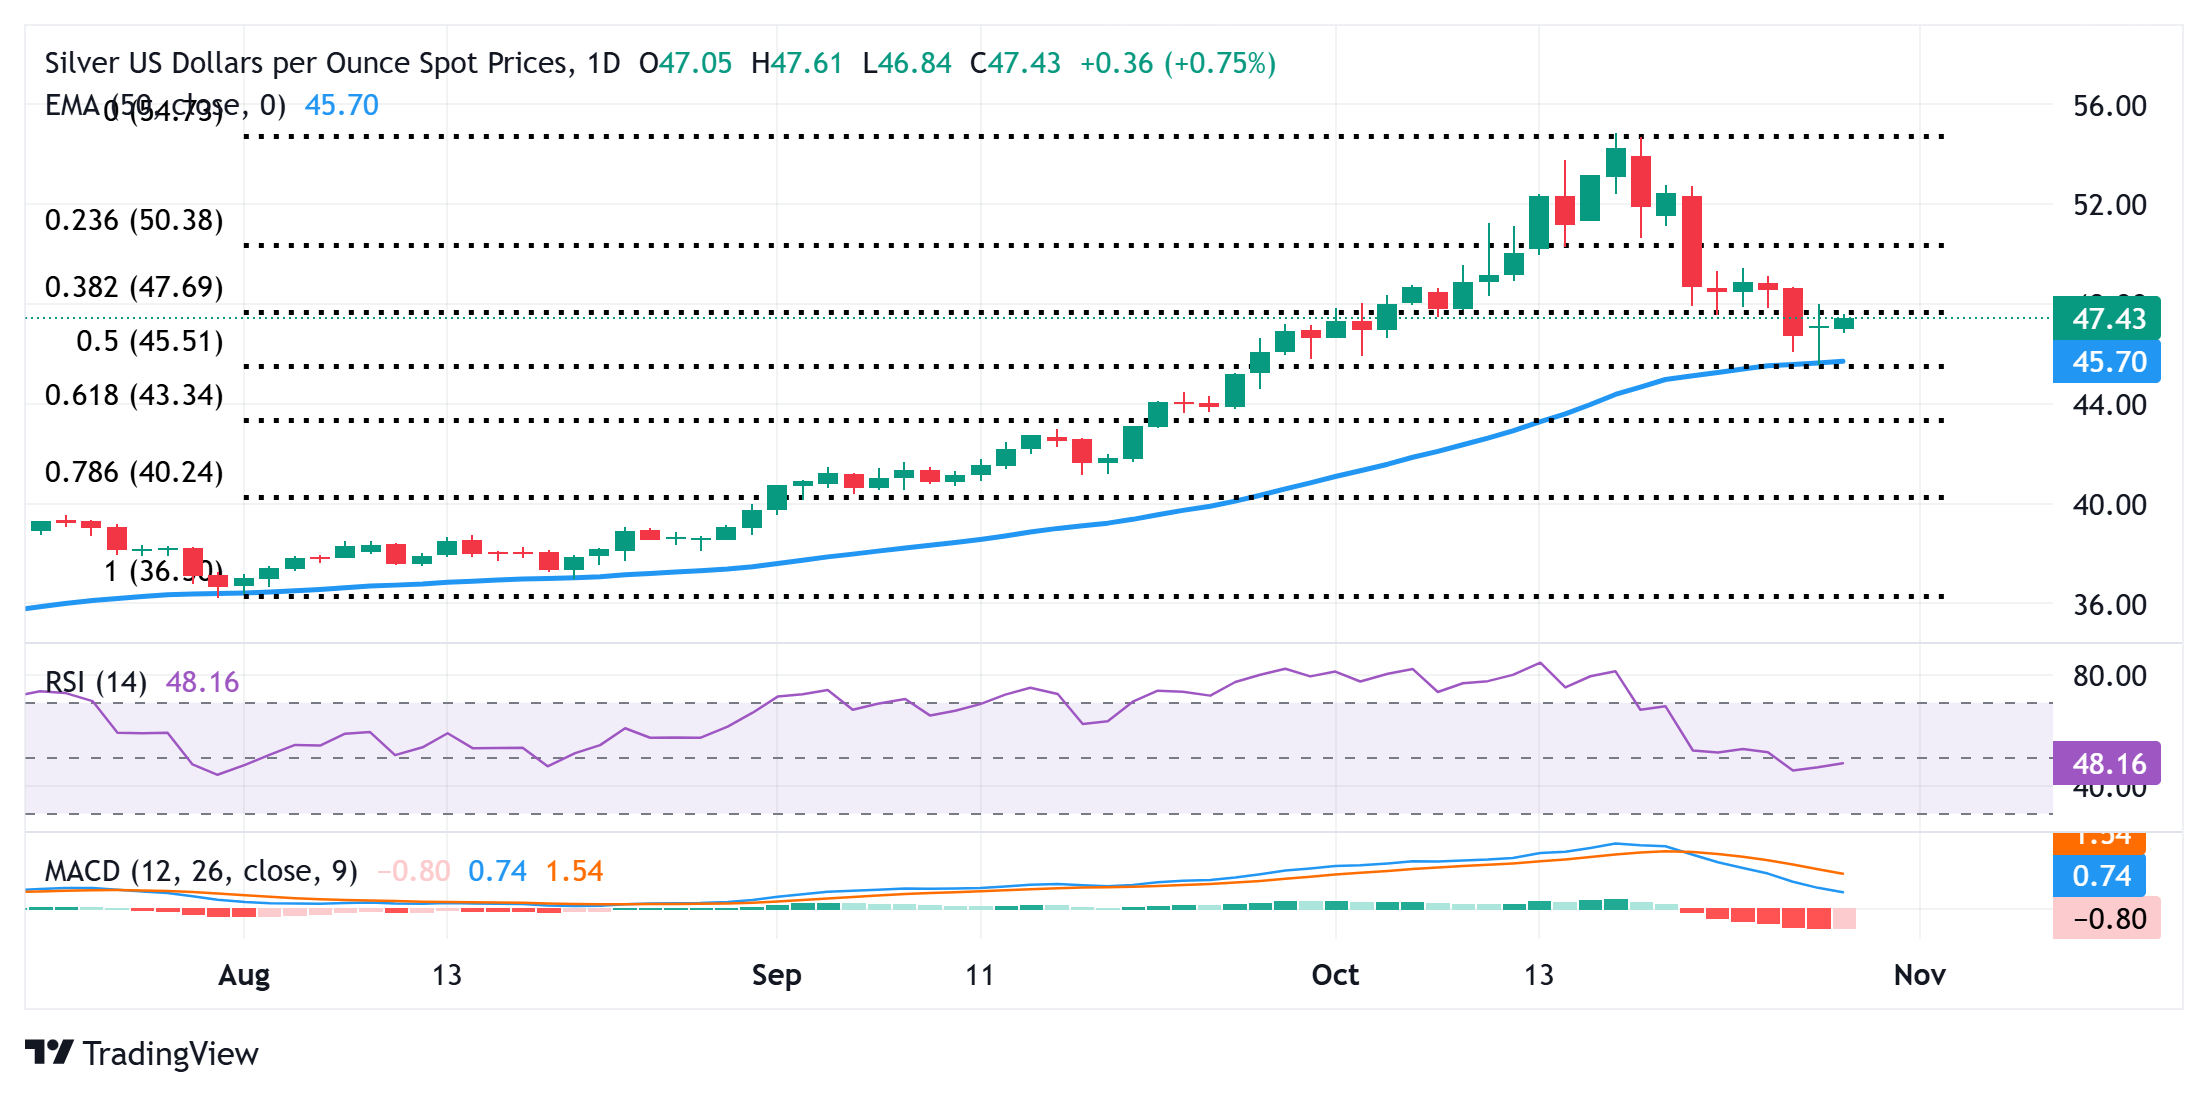
From a technical perspective, the XAG/USD found decent support near the 50-day Exponential Moving Average (SMA) on Tuesday, which now coincides with the 50% Fibonacci retracement level of the August-October blowout rally. Furthermore, the subsequent move up suggests that the recent corrective decline from the all-time peak touched earlier this month might have run its course. However, oscillators on the daily chart have just started gaining negative traction.
Hence, any further move up beyond the $48.00 round figure is more likely to attract some sellers and face stiff resistance near the $48.65-$48.70 region. However, some follow-through buying beyond the $49.00 mark might negate the negative outlook and trigger a fresh wave of the short-covering move. The XAG/USD might then extend the recovery momentum towards the $49.45 intermediate resistance before aiming towards reclaiming the $50.00 psychological mark.
On the flip side, the $47.00-$46.95 area now seems to protect the immediate downside, below which the XAG/USD could slide back below the $46.00 round figure and retest the overnight swing low, around the $45.55 confluence. A convincing break below the latter will be seen as a fresh trigger for bearish traders and make the white metal extend the fall to the $45.00 psychological mark en route to the $44.45 region, the $44.00 mark, and the $43.55 area (61.8% Fibo. level).
Silver daily chart
Silver FAQs
Silver is a precious metal highly traded among investors. It has been historically used as a store of value and a medium of exchange. Although less popular than Gold, traders may turn to Silver to diversify their investment portfolio, for its intrinsic value or as a potential hedge during high-inflation periods. Investors can buy physical Silver, in coins or in bars, or trade it through vehicles such as Exchange Traded Funds, which track its price on international markets.
Silver prices can move due to a wide range of factors. Geopolitical instability or fears of a deep recession can make Silver price escalate due to its safe-haven status, although to a lesser extent than Gold's. As a yieldless asset, Silver tends to rise with lower interest rates. Its moves also depend on how the US Dollar (USD) behaves as the asset is priced in dollars (XAG/USD). A strong Dollar tends to keep the price of Silver at bay, whereas a weaker Dollar is likely to propel prices up. Other factors such as investment demand, mining supply – Silver is much more abundant than Gold – and recycling rates can also affect prices.
Silver is widely used in industry, particularly in sectors such as electronics or solar energy, as it has one of the highest electric conductivity of all metals – more than Copper and Gold. A surge in demand can increase prices, while a decline tends to lower them. Dynamics in the US, Chinese and Indian economies can also contribute to price swings: for the US and particularly China, their big industrial sectors use Silver in various processes; in India, consumers’ demand for the precious metal for jewellery also plays a key role in setting prices.
Silver prices tend to follow Gold's moves. When Gold prices rise, Silver typically follows suit, as their status as safe-haven assets is similar. The Gold/Silver ratio, which shows the number of ounces of Silver needed to equal the value of one ounce of Gold, may help to determine the relative valuation between both metals. Some investors may consider a high ratio as an indicator that Silver is undervalued, or Gold is overvalued. On the contrary, a low ratio might suggest that Gold is undervalued relative to Silver.
Author

Haresh Menghani
FXStreet
Haresh Menghani is a detail-oriented professional with 10+ years of extensive experience in analysing the global financial markets.


