Silver Price Forecast: XAG/USD rebounds and climbs above $31.00
- Silver prices bounce and cleared the October 9 high of $30.77, following mixed US inflation and jobs data.
- Momentum turns slightly bullish, with buyers in control, as RSI breaks above the neutral 50 level.
- Key resistance lies at $31.50 for a bullish continuation, targeting $32.00 and the YTD high of $32.95; a drop below $31.00 could trigger a pullback toward $30.22 and $30.12.

Silver prices bounced off a three-week low, rallied over 0.60%, and traded at $31.12 at the time of writing. Mixed data from the United States (US) showed inflation edging up, and a soft jobs report. Although it triggered some upside in the precious metal, hawkish remarks by Atlanta’s Fed President Raphael Bostic capped Silver’s advance.
XAG/USD Price Forecast: Technical outlook
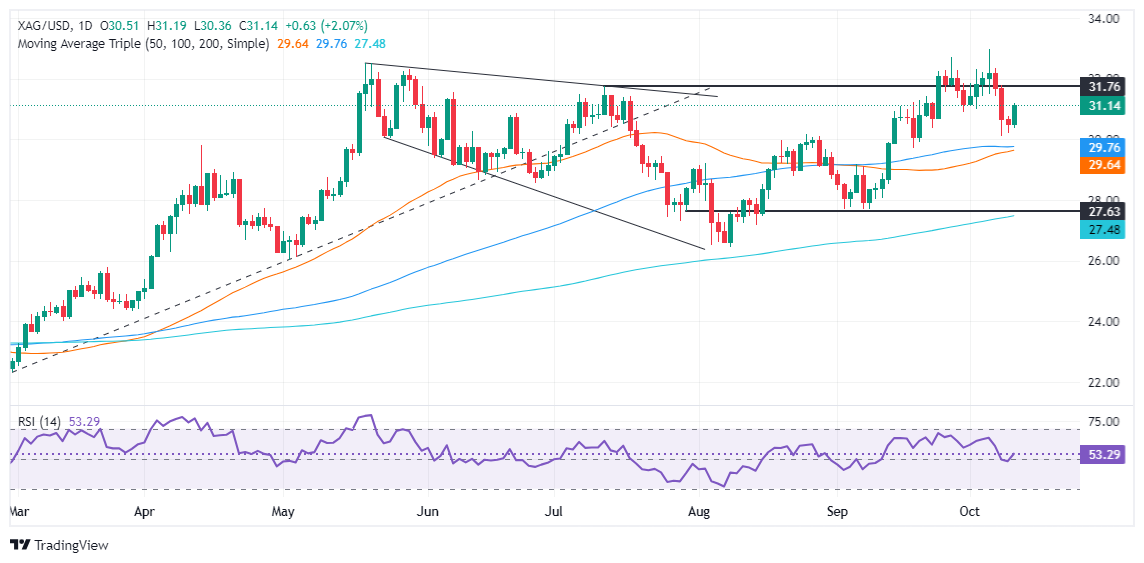
Silver prices have cleared the October 9 daily high of $30.77, extending their gains past the $31.00 figure. Nevertheless, Silver’s is not out of the woods after Tuesday’s plunge of over 3.20%, pushing the grey’s metal to hit a multi-week low.
Momentum shifted slightly bullishly, as seen by the Relative Strength Index (RSI) piercing the 50 neutral lines, suggesting buyers regained control.
For a bullish continuation, XAG/USD must clear the psychological level of $31.50. Once surpassed, the next stop would be the $32.00 figure, followed by the year-to-date (YTD) high of $32.95.
Conversely, if Silver drops below $31.00, this could pave the way for a pullback. The first support would be the October 9 low of $30.22, followed by the October 8 swing low of $30.12.
XAG/USD Price Action – Daily Chart
Silver FAQs
Silver is a precious metal highly traded among investors. It has been historically used as a store of value and a medium of exchange. Although less popular than Gold, traders may turn to Silver to diversify their investment portfolio, for its intrinsic value or as a potential hedge during high-inflation periods. Investors can buy physical Silver, in coins or in bars, or trade it through vehicles such as Exchange Traded Funds, which track its price on international markets.
Silver prices can move due to a wide range of factors. Geopolitical instability or fears of a deep recession can make Silver price escalate due to its safe-haven status, although to a lesser extent than Gold's. As a yieldless asset, Silver tends to rise with lower interest rates. Its moves also depend on how the US Dollar (USD) behaves as the asset is priced in dollars (XAG/USD). A strong Dollar tends to keep the price of Silver at bay, whereas a weaker Dollar is likely to propel prices up. Other factors such as investment demand, mining supply – Silver is much more abundant than Gold – and recycling rates can also affect prices.
Silver is widely used in industry, particularly in sectors such as electronics or solar energy, as it has one of the highest electric conductivity of all metals – more than Copper and Gold. A surge in demand can increase prices, while a decline tends to lower them. Dynamics in the US, Chinese and Indian economies can also contribute to price swings: for the US and particularly China, their big industrial sectors use Silver in various processes; in India, consumers’ demand for the precious metal for jewellery also plays a key role in setting prices.
Silver prices tend to follow Gold's moves. When Gold prices rise, Silver typically follows suit, as their status as safe-haven assets is similar. The Gold/Silver ratio, which shows the number of ounces of Silver needed to equal the value of one ounce of Gold, may help to determine the relative valuation between both metals. Some investors may consider a high ratio as an indicator that Silver is undervalued, or Gold is overvalued. On the contrary, a low ratio might suggest that Gold is undervalued relative to Silver.
Author

Christian Borjon Valencia
FXStreet
Markets analyst, news editor, and trading instructor with over 14 years of experience across FX, commodities, US equity indices, and global macro markets.


