Silver Price Forecast: XAG/USD rallies to near $33.20 amid geopolitical and trade worries
- Silver price strengthens and jumps to near $33.20 amid multiple tailwinds.
- US President Trump’s tariff agenda could lead to a global economic slowdown.
- The Fed is expected to maintain a restrictive interest rate stance for longer.

Silver price (XAG/USD) surges almost 1.5% to near $33.20 in European trading hours on Thursday. The white metal strengthens as investors remain concerned over deepening global trade tensions. United States (US) President Donald Trump announced on Wednesday that he is planning to impose tariffs on lumber, cars, semiconductors, and pharmaceuticals over the next month or sooner.
Market participants expect President Trump's tariffs would lead to a global trade war, which would result in an economic slowdown across the globe.
Meanwhile, Donald Trump has also ordered his team to prepare reciprocal tariffs, which are expected to be unveiled in April.
On the geopolitical front, Ukraine President Volodymyr Zelenskyy feeling left out of Russia-US peace talks to end the war in Ukraine has raised some uncertainty. Ukrainian leader has condemned US Trump for initiating peace talks with Russia without his involvement in discussing the issue in Saudi Arabia.
Signs of a slowdown in the Russia-Ukraine peace talks would boost demand for safe-haven assets, such as Silver.
Meanwhile, the safe-haven demand of the US Dollar has remained weak even though traders becoming increasingly confident that the Federal Reserve (Fed) will keep interest rates in the current range of 4.25%-4.50% for longer. The US Dollar Index (DXY), which tracks the Greenback’s value against six major currencies, declines to near 106.90.
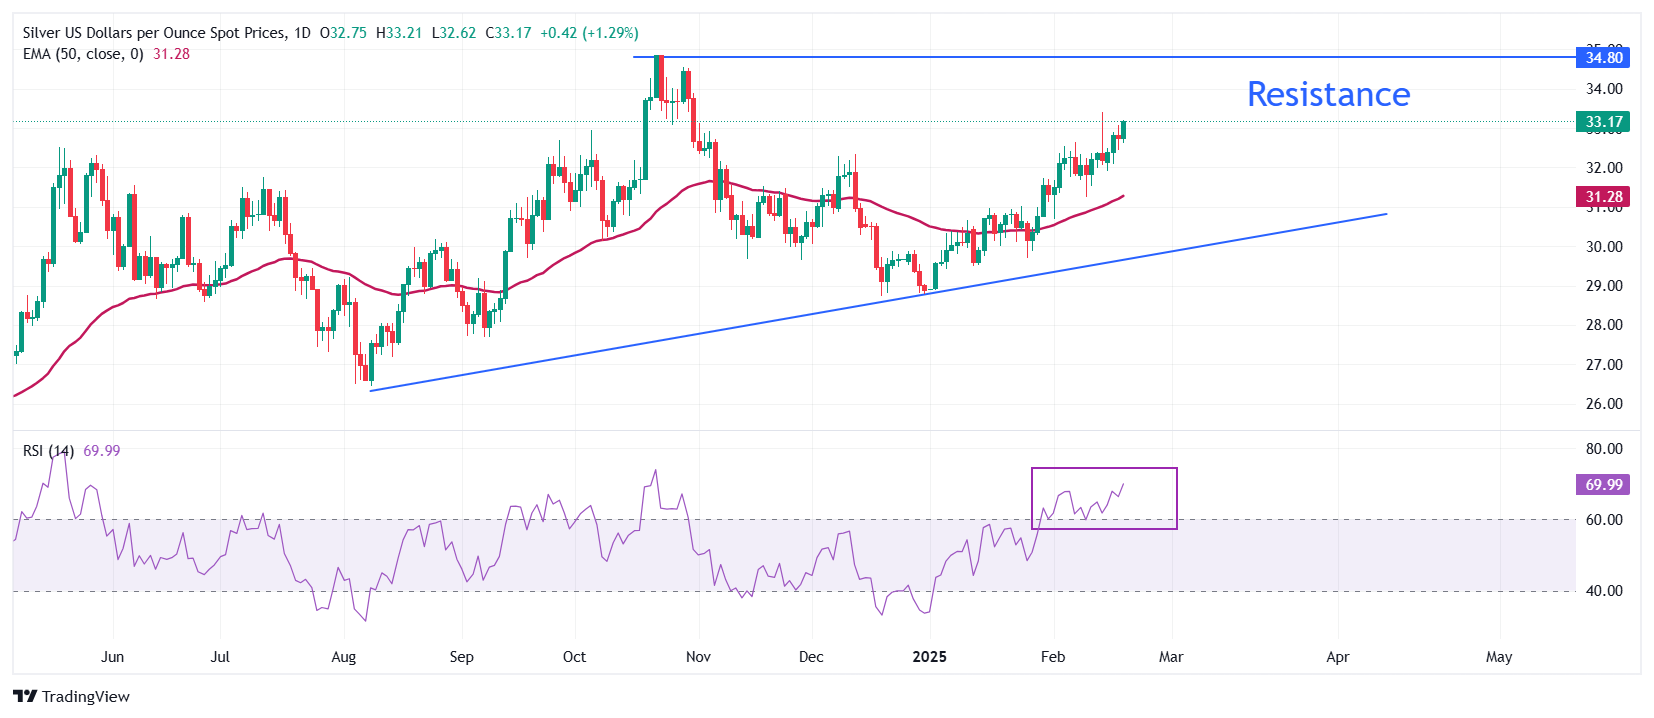
Silver technical analysis
Silver price is inch far from revisiting an over three-month high of $33.40, which it posted on February 14. The outlook of the white metal is bullish as the 50-day Exponential Moving Average (EMA) has been sloping higher, which trades around $31.28.
The 14-day Relative Strength Index (RSI) oscillates in the 60.00-80.00 range, suggesting that the momentum is strongly bullish.
Looking down, the upward-sloping trendline from the August 8 low of $26.45 will act as key support for the Silver price around $30.00. While, the October 22 high of $34.87 will be the key barrier.
Silver daily chart
Silver FAQs
Silver is a precious metal highly traded among investors. It has been historically used as a store of value and a medium of exchange. Although less popular than Gold, traders may turn to Silver to diversify their investment portfolio, for its intrinsic value or as a potential hedge during high-inflation periods. Investors can buy physical Silver, in coins or in bars, or trade it through vehicles such as Exchange Traded Funds, which track its price on international markets.
Silver prices can move due to a wide range of factors. Geopolitical instability or fears of a deep recession can make Silver price escalate due to its safe-haven status, although to a lesser extent than Gold's. As a yieldless asset, Silver tends to rise with lower interest rates. Its moves also depend on how the US Dollar (USD) behaves as the asset is priced in dollars (XAG/USD). A strong Dollar tends to keep the price of Silver at bay, whereas a weaker Dollar is likely to propel prices up. Other factors such as investment demand, mining supply – Silver is much more abundant than Gold – and recycling rates can also affect prices.
Silver is widely used in industry, particularly in sectors such as electronics or solar energy, as it has one of the highest electric conductivity of all metals – more than Copper and Gold. A surge in demand can increase prices, while a decline tends to lower them. Dynamics in the US, Chinese and Indian economies can also contribute to price swings: for the US and particularly China, their big industrial sectors use Silver in various processes; in India, consumers’ demand for the precious metal for jewellery also plays a key role in setting prices.
Silver prices tend to follow Gold's moves. When Gold prices rise, Silver typically follows suit, as their status as safe-haven assets is similar. The Gold/Silver ratio, which shows the number of ounces of Silver needed to equal the value of one ounce of Gold, may help to determine the relative valuation between both metals. Some investors may consider a high ratio as an indicator that Silver is undervalued, or Gold is overvalued. On the contrary, a low ratio might suggest that Gold is undervalued relative to Silver.
Author

Sagar Dua
FXStreet
Sagar Dua is associated with the financial markets from his college days. Along with pursuing post-graduation in Commerce in 2014, he started his markets training with chart analysis.


