Silver Price Forecast: XAG/USD rallies to mid-$40.00s, highest since September 2011
- Silver builds on last week’s breakout momentum beyond the previous YTD peak.
- The technical setup favors bulls and backs the case for a further appreciating move.
- The daily RSI has moved closer to the overbought zone and warrants some caution.

Silver (XAG/USD) gains strong follow-through positive traction for the third successive day and rallies to the $40.50-$40.55 area, or its highest level since September 2011, during the Asian session on Monday.
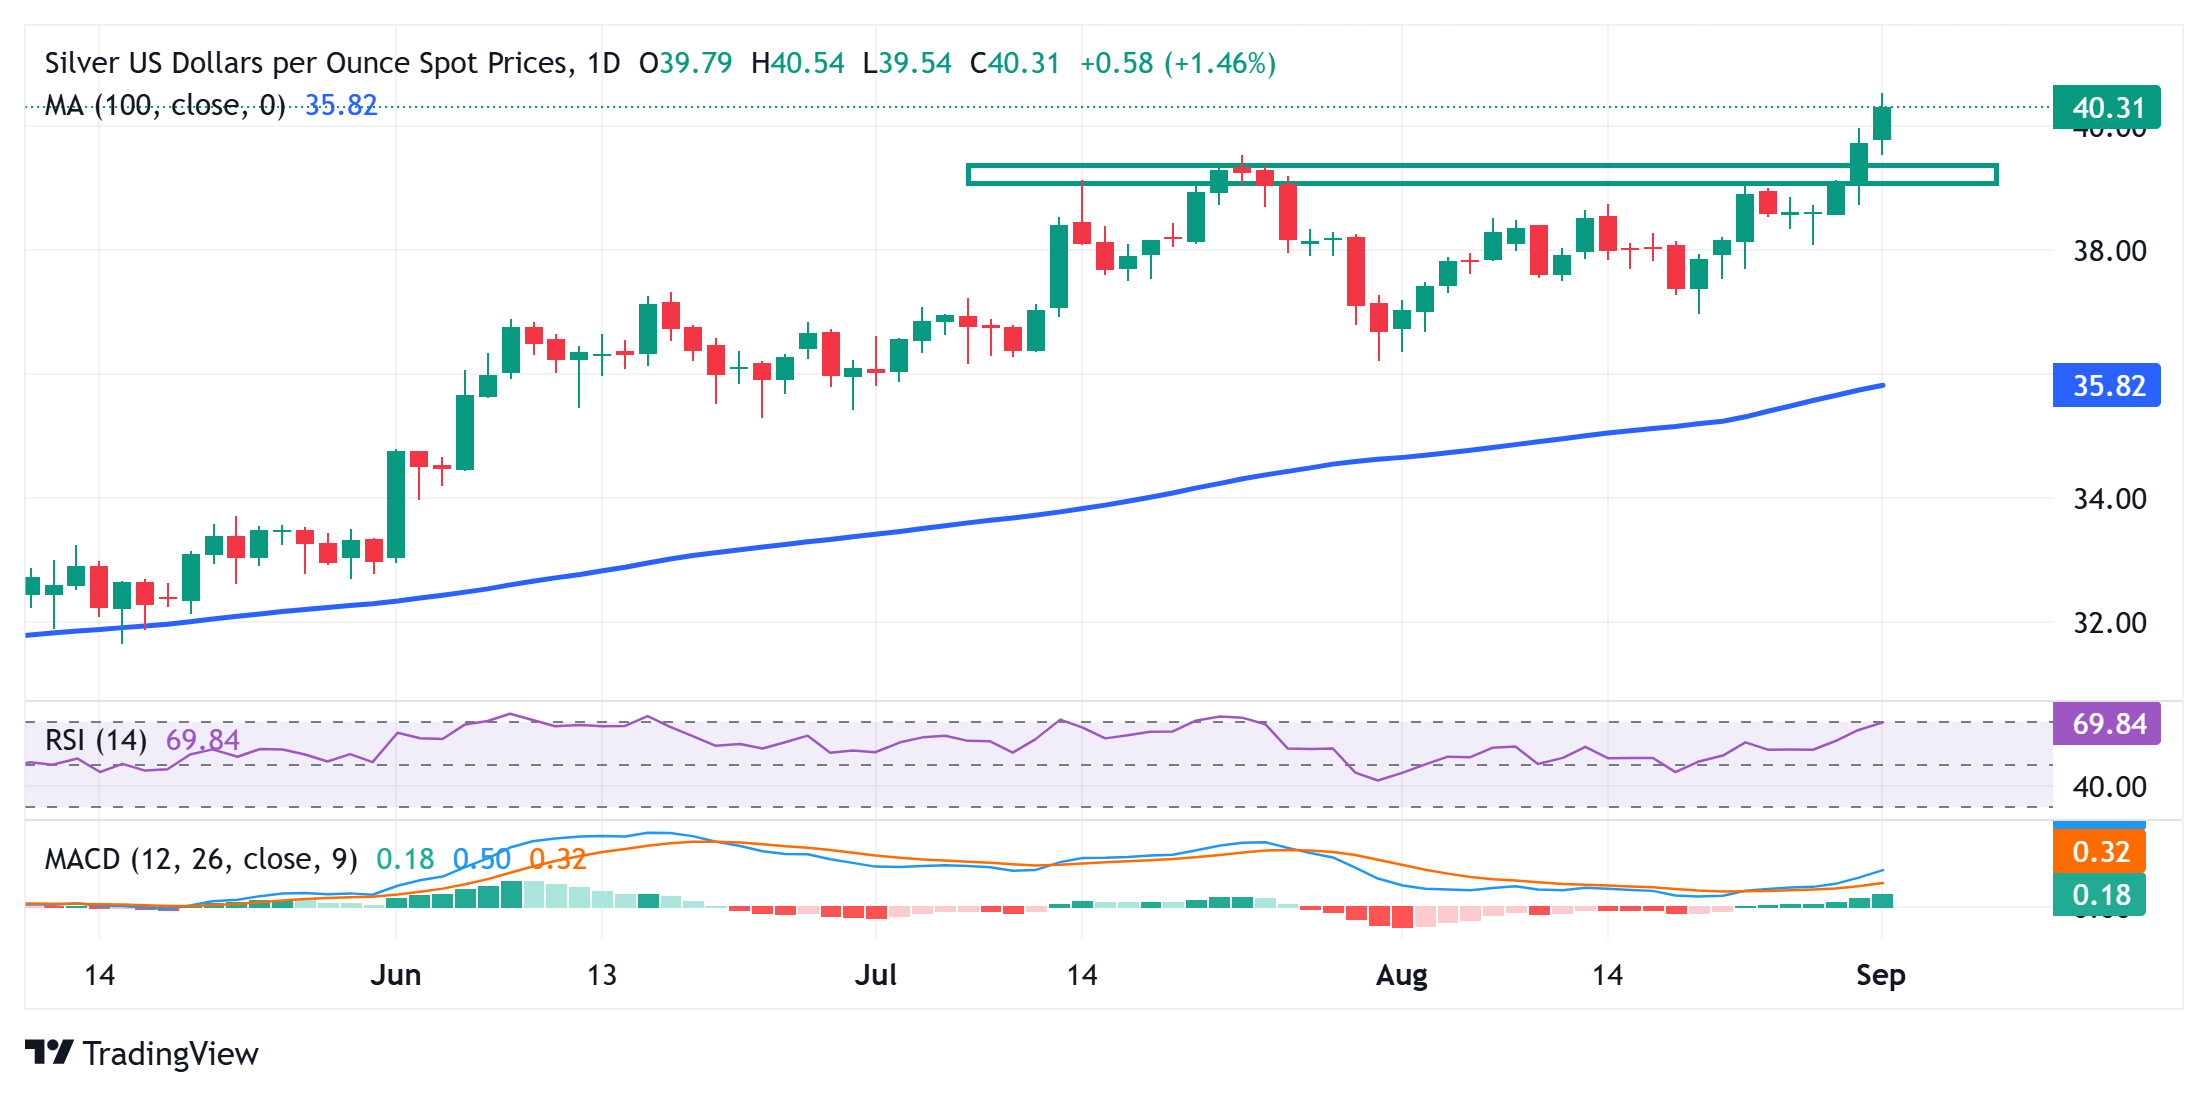
From a technical perspective, last week's sustained daily close above the $39.00 mark, a subsequent move beyond the previous multi-year top, around the $39.50 zone, and the $40.00 psychological mark was seen as a fresh trigger for the XAG/USD bulls. Moreover, positive oscillators on the daily chart aided the momentum.
Meanwhile, the daily Relative Strength Index (RSI) on the daily chart has now moved to the verge of breaking into overbought territory. This makes it prudent to wait for some consolidation or a modest pullback before placing fresh bullish bets around the XAG/USD and positioning for any further appreciating move.
In the meantime, any corrective pullback is likely to attract dip-buyers near the $40.00 mark. This is followed by the $39.50 zone, which should now act as a strong near-term base for the XAG/USD. A convincing break below, however, might prompt some technical selling and pave the way for deeper losses in the near term.
On the flip side, the Asian session high, around the $40.50-$40.55 region, could act as an immediate hurdle, above which the XAG/USD bulls could aim to reclaim the $41.00 round figure. The upward trajectory could extend further towards testing the next relevant resistance just ahead of the $41.50 area.
Silver daily chart
Silver FAQs
Silver is a precious metal highly traded among investors. It has been historically used as a store of value and a medium of exchange. Although less popular than Gold, traders may turn to Silver to diversify their investment portfolio, for its intrinsic value or as a potential hedge during high-inflation periods. Investors can buy physical Silver, in coins or in bars, or trade it through vehicles such as Exchange Traded Funds, which track its price on international markets.
Silver prices can move due to a wide range of factors. Geopolitical instability or fears of a deep recession can make Silver price escalate due to its safe-haven status, although to a lesser extent than Gold's. As a yieldless asset, Silver tends to rise with lower interest rates. Its moves also depend on how the US Dollar (USD) behaves as the asset is priced in dollars (XAG/USD). A strong Dollar tends to keep the price of Silver at bay, whereas a weaker Dollar is likely to propel prices up. Other factors such as investment demand, mining supply – Silver is much more abundant than Gold – and recycling rates can also affect prices.
Silver is widely used in industry, particularly in sectors such as electronics or solar energy, as it has one of the highest electric conductivity of all metals – more than Copper and Gold. A surge in demand can increase prices, while a decline tends to lower them. Dynamics in the US, Chinese and Indian economies can also contribute to price swings: for the US and particularly China, their big industrial sectors use Silver in various processes; in India, consumers’ demand for the precious metal for jewellery also plays a key role in setting prices.
Silver prices tend to follow Gold's moves. When Gold prices rise, Silver typically follows suit, as their status as safe-haven assets is similar. The Gold/Silver ratio, which shows the number of ounces of Silver needed to equal the value of one ounce of Gold, may help to determine the relative valuation between both metals. Some investors may consider a high ratio as an indicator that Silver is undervalued, or Gold is overvalued. On the contrary, a low ratio might suggest that Gold is undervalued relative to Silver.
Author

Haresh Menghani
FXStreet
Haresh Menghani is a detail-oriented professional with 10+ years of extensive experience in analysing the global financial markets.


