Silver Price Forecast: XAG/USD plummets to near $33.00 on US-China trade talks
- Silver price falls sharply to near $33.00 on hopes of de-escalation in Sino-US trade war.
- China considers pausing tariffs on some US imports.
- Beijing denies any economic and trade talks with the US.

Silver price (XAG/USD) plunges more than 1.5% to near $33.00 during North American trading hours on Friday. The white metal falls sharply from its three-week high of $33.70 posted earlier in the day. The asset weakens as investors have become increasingly confident that the United States (US) and China will make a deal sooner.
Hopes of a truce on a trade war between the world’s two largest powerhouses have increased as China has stated that it is considering suspending additional tariffs on imports of medical equipment and some industrial chemicals from the US, Bloomberg reported.
Investors see the scenario as favorable for the global economic outlook. Theoretically, improving global economic prospects diminish the demand of safe-haven assets, such as Silver.
Meanwhile, the US Dollar (USD) has bounced back after a sharp corrective move on Thursday. The US Dollar Index (DXY), which tracks the Greenback’s value against six major currencies, recovers to near 99.75.
However, contradictory statements from US President Donald Trump and China over whether both nations have come on the table or not for negotiating trade deals are expected to keep investors on the sidelines. Trump has been stating that discussion between Washington and Beijing on trade are going well, however, China has denied these remarks, saying that there has not been any “economic and trade negotiations between China and the US”.
Silver technical analysis
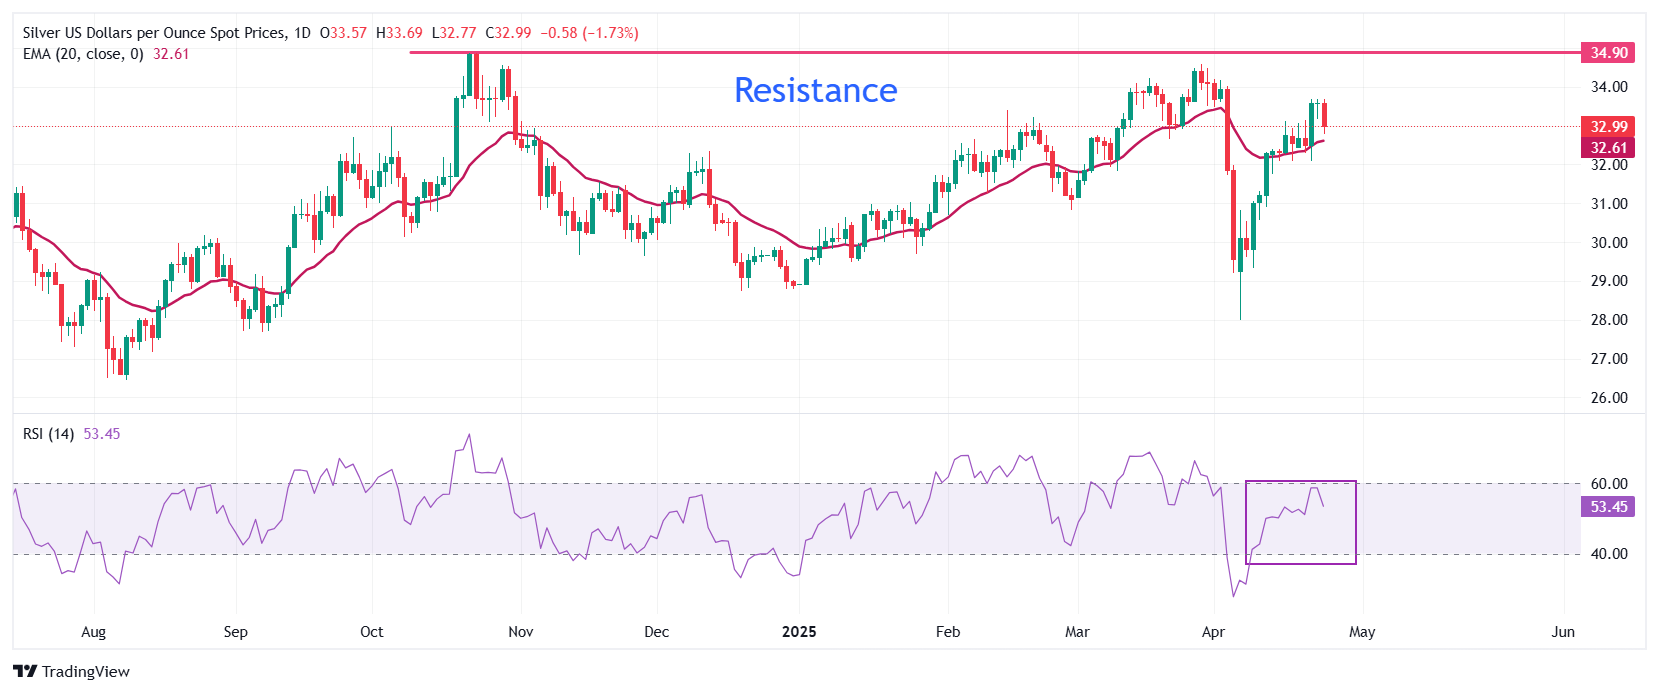
Silver price falls sharply after posting a fresh three-week high around $33.70. However, the near-term outlook of the white metal remains bullish as it holds the 20-day Exponential Moving Average (EMA), which trades around $32.60.
The 14-day Relative Strength Index (RSI) struggles to break above 60.00. A fresh bullish momentum would emerge if the RSI will break above that level.
Looking up, the March 28 high of $34.60 will act as key resistance for the metal. On the downside, the April 11 low of $30.90 will be the key support zone.
Silver daily chart
Silver FAQs
Silver is a precious metal highly traded among investors. It has been historically used as a store of value and a medium of exchange. Although less popular than Gold, traders may turn to Silver to diversify their investment portfolio, for its intrinsic value or as a potential hedge during high-inflation periods. Investors can buy physical Silver, in coins or in bars, or trade it through vehicles such as Exchange Traded Funds, which track its price on international markets.
Silver prices can move due to a wide range of factors. Geopolitical instability or fears of a deep recession can make Silver price escalate due to its safe-haven status, although to a lesser extent than Gold's. As a yieldless asset, Silver tends to rise with lower interest rates. Its moves also depend on how the US Dollar (USD) behaves as the asset is priced in dollars (XAG/USD). A strong Dollar tends to keep the price of Silver at bay, whereas a weaker Dollar is likely to propel prices up. Other factors such as investment demand, mining supply – Silver is much more abundant than Gold – and recycling rates can also affect prices.
Silver is widely used in industry, particularly in sectors such as electronics or solar energy, as it has one of the highest electric conductivity of all metals – more than Copper and Gold. A surge in demand can increase prices, while a decline tends to lower them. Dynamics in the US, Chinese and Indian economies can also contribute to price swings: for the US and particularly China, their big industrial sectors use Silver in various processes; in India, consumers’ demand for the precious metal for jewellery also plays a key role in setting prices.
Silver prices tend to follow Gold's moves. When Gold prices rise, Silver typically follows suit, as their status as safe-haven assets is similar. The Gold/Silver ratio, which shows the number of ounces of Silver needed to equal the value of one ounce of Gold, may help to determine the relative valuation between both metals. Some investors may consider a high ratio as an indicator that Silver is undervalued, or Gold is overvalued. On the contrary, a low ratio might suggest that Gold is undervalued relative to Silver.
Author

Sagar Dua
FXStreet
Sagar Dua is associated with the financial markets from his college days. Along with pursuing post-graduation in Commerce in 2014, he started his markets training with chart analysis.


