|

Silver Price Forecast: XAG/USD plummets to $26 despite weak US NFP data

  • Silver price plunges to $26 despite a sell-off in the US Dollar and bond yields.
  • The US NFP report for April exhibited weak labor demand and soft wage growth.
  • Weak labor demand will boost Fed rate cut prospects for September.

Silver price (XAG/USD) reverses gains and falls sharply to $26.00 despite the United States Nonfarm Payrolls (NFP) data for April turned out weaker than expected. The US NFP report showed that employers hired 175K job-seekers, weaker than the consensus of 243K and the prior reading of 315K, upwardly revised from 303K. The Unemployment Rate rises to 3.9% while investors forecasted it to remain steady at 3.8%.

The Average Hourly Earnings, which feeds the consumer spending and eventually reflects the inflation outlook, softened to 3.9%. Investors forecasted the wage growth to decelerate to 4.0% from March’s reading of 4.1%. Monthly wage growth data grew at a slower pace of 0.2%, against the estimates and the prior reading of 0.3%.

Weak labor demand and soft wage growth would force the Federal Reserve (Fed) to unwind its restrictive policy framework earlier, which it has been maintaining for almost two years. Currently, investors expect that the Fed will start reducing interest rates from the September meeting. The situation is unfavorable for the US Dollar and Treasury yields. The US Dollar Index (DXY), which tracks the Greenback’s value against six major currencies, prints a fresh three-week low around 104.50. 10-year US Treasury Yields weaken to 4.49%.

Generally, lower yields on interest-bearing assets weigh on non-yielding assets such as Silver as they reduce the opportunity cost of holding investment in them. Therefore, the Silver price could reverse losses ahead.

Silver technical analysis

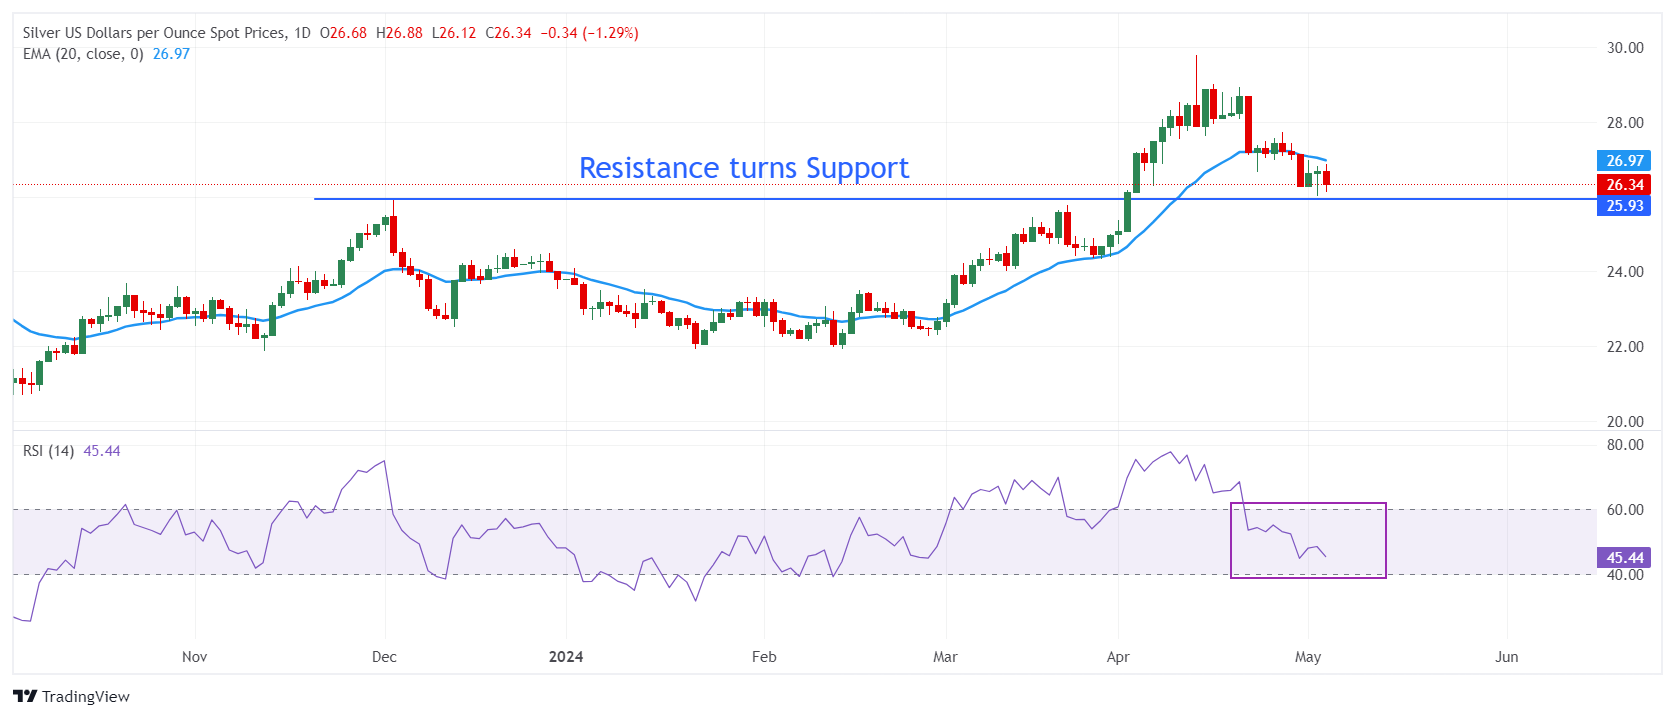
Silver price declines to near the horizontal support plotted from 14 April 2023 high around $26.09 on a daily timeframe. The above-mentioned support was earlier a major resistance for the Silver price bulls. The uncertainty over Silver’s near-term outlook deepens as it has slipped below the 20-period Exponential Moving Average (EMA), which trades around $27.20.

The 14-period Relative Strength Index (RSI) slips into the 40.00-60.00, suggesting that the bullish momentum has faded. However, the long-term outlook is still stable.

Silver daily chart

XAG/USD

Overview
Today last price26.34
Today Daily Change-0.34
Today Daily Change %-1.27
Today daily open26.68
 
Trends
Daily SMA2027.65
Daily SMA5025.7
Daily SMA10024.42
Daily SMA20023.82
 
Levels
Previous Daily High26.82
Previous Daily Low26.02
Previous Weekly High28.69
Previous Weekly Low26.67
Previous Monthly High29.8
Previous Monthly Low24.75
Daily Fibonacci 38.2%26.51
Daily Fibonacci 61.8%26.32
Daily Pivot Point S126.19
Daily Pivot Point S225.7
Daily Pivot Point S325.39
Daily Pivot Point R127
Daily Pivot Point R227.31
Daily Pivot Point R327.8

Author

Sagar Dua

Sagar Dua

FXStreet

Sagar Dua is associated with the financial markets from his college days. Along with pursuing post-graduation in Commerce in 2014, he started his markets training with chart analysis.

More from Sagar Dua
Share:

Editor's Picks

EUR/USD looks sidelined around 1.1850

EUR/USD remains on the back foot, extending its bearish tone and sliding towards the 1.1850 area to print fresh daily lows on Monday. The move lower comes as the US Dollar gathers modest traction, with thin liquidity and subdued volatility amplifying price swings amid the US market holiday.

GBP/USD flirts with daily lows near 1.3630

GBP/USD has quickly given back Friday’s solid gains, turning lower at the start of the week and drifting back towards the 1.3630 area. The focus now shifts squarely to Tuesday’s UK labour market report, which is likely to keep the quid firmly in the spotlight and could set the tone for Cable’s next move.

Gold battle around $5,000 continues

Gold is giving back part of Friday’s sharp rebound, deflating below the key $5,000 mark per troy ounce as the new week gets underway. Modest gains in the US Dollar are keeping the metal in check, while thin trading conditions, due to the Presidents Day holiday in the US, are adding to the choppy and hesitant tone across markets.

Bitcoin consolidates as on-chain data show mixed signals

Bitcoin price has consolidated between $65,700 and $72,000 over the past nine days, with no clear directional bias. US-listed spot ETFs recorded a $359.91 million weekly outflow, marking the fourth consecutive week of withdrawals.

The week ahead: Key inflation readings and why the AI trade could be overdone

It is likely to be a quiet start to the week, with US markets closed on Monday for Presidents Day. European markets are higher across the board and gold is clinging to the $5,000 level after the tamer than expected CPI report in the US reduced haven flows to precious metals.

XRP steadies in narrow range as fund inflows, futures interest rise

Ripple is trading in a narrow range between $1.45 (immediate support) and $1.50 (resistance) at the time of writing on Monday. The remittance token extended its recovery last week, peaking at $1.67 on Sunday from the weekly open at $1.43.