Silver Price Forecast: XAG/USD nosedives below $32 on “Buy the Rumour Sell the News”
- Silver price falls vertically below $32.00 after US President Trump announces reciprocal tariffs.
- A significant increase in the import duty on China has weighed on the Silver’s demand outlook.
- Investors await the US NFP data, which will influence Fed’s monetary policy outlook.

Silver price is down almost 5% during North American trading hours on Thursday, tests territory below $32.00. The price of the white metal has become vulnerable after United States (US) President Donald Trump unveiled a detailed reciprocal tariff plan for his trading partners.
The “Buy the Rumour and Sell the News” indicator forced traders to trigger the sell button for the Silver price. The previous metal was performing strongly, along with Gold, from the past few months as investors were increasingly confident that Trump’s tariffs would be inflationary and weigh on economic growth globally, including in the US. Technically, the appeal of the Silver price increases if investors anticipate heightening global economic tensions.
Fears of a US economic slowdown have also weighed on the US Dollar (USD). The US Dollar Index (DXY), which tracks the Greenback’s value against six major currencies, nosedives to near 101.30, the lowest level seen in six months.
Additionally, escalated concerns over the demand of Silver by industries has also sent its price strongly on the ground. On Wednesday, Donald Trump announced a 34% import duty on China, in addition to the 20% levy already imposed for pouring drugs into the US economy. A significant increase in tariffs by Trump on China is expected to dampen its manufacturing sector. Such a scenario will weaken the demand for Silver by Chinese firms, given its application in various industries such as Electric Vehicles (EV), electronics, and solar energy.
Going forward, investors will focus on the US Nonfarm Payrolls (NFP) data for March, which will be published on Friday. The employment data will influence market expectations for the Federal Reserve’s (Fed) monetary policy outlook.
Silver technical analysis
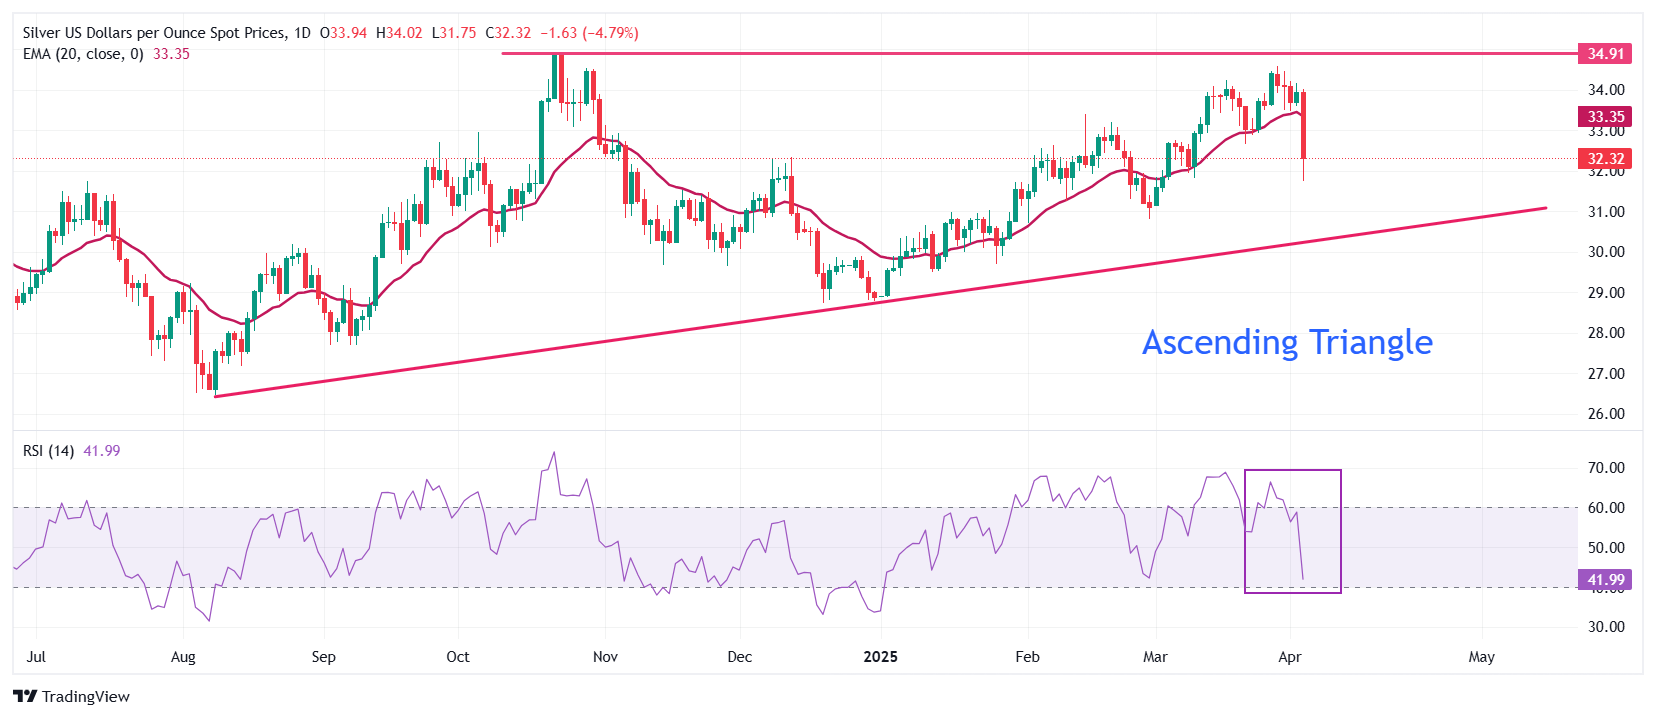
Silver price falls like a house of cards after failing to revisit the flat border of the Ascending Triangle chart pattern formation on the daily timeframe near the October 22 high of $34.87. The upward-sloping border of the above-mentioned chart pattern is placed from the August 8 low of $26.45. Technically, the Ascending Triangle pattern indicates indecisiveness among market participants.
The Silver price slides below the 20-day Exponential Moving Average (EMA), which is around $33.35, indicating that the near-term trend has turned bearish.
The 14-day Relative Strength Index (RSI) slumps to near 40.00. A bullish momentum would emerge if the RSI fails to hold the 40.00 level.
Looking down, the February 28 low of $30.82 will act as key support for the Silver price. While, the October 22 high of $34.87 will be the major barrier.
Silver daily chart
Silver FAQs
Silver is a precious metal highly traded among investors. It has been historically used as a store of value and a medium of exchange. Although less popular than Gold, traders may turn to Silver to diversify their investment portfolio, for its intrinsic value or as a potential hedge during high-inflation periods. Investors can buy physical Silver, in coins or in bars, or trade it through vehicles such as Exchange Traded Funds, which track its price on international markets.
Silver prices can move due to a wide range of factors. Geopolitical instability or fears of a deep recession can make Silver price escalate due to its safe-haven status, although to a lesser extent than Gold's. As a yieldless asset, Silver tends to rise with lower interest rates. Its moves also depend on how the US Dollar (USD) behaves as the asset is priced in dollars (XAG/USD). A strong Dollar tends to keep the price of Silver at bay, whereas a weaker Dollar is likely to propel prices up. Other factors such as investment demand, mining supply – Silver is much more abundant than Gold – and recycling rates can also affect prices.
Silver is widely used in industry, particularly in sectors such as electronics or solar energy, as it has one of the highest electric conductivity of all metals – more than Copper and Gold. A surge in demand can increase prices, while a decline tends to lower them. Dynamics in the US, Chinese and Indian economies can also contribute to price swings: for the US and particularly China, their big industrial sectors use Silver in various processes; in India, consumers’ demand for the precious metal for jewellery also plays a key role in setting prices.
Silver prices tend to follow Gold's moves. When Gold prices rise, Silver typically follows suit, as their status as safe-haven assets is similar. The Gold/Silver ratio, which shows the number of ounces of Silver needed to equal the value of one ounce of Gold, may help to determine the relative valuation between both metals. Some investors may consider a high ratio as an indicator that Silver is undervalued, or Gold is overvalued. On the contrary, a low ratio might suggest that Gold is undervalued relative to Silver.
Author

Sagar Dua
FXStreet
Sagar Dua is associated with the financial markets from his college days. Along with pursuing post-graduation in Commerce in 2014, he started his markets training with chart analysis.


