Silver Price Forecast: XAG/USD falls for third straight day, pressured by firm US Dollar
- XAG/USD drops below $36.50, marking its third straight daily decline as the US Dollar and yields firm up.
- Silver remains stuck between $35.50 and $37.30, inside a broader rising channel since April.
- The 21-day EMA acts as a dynamic support, but a break below could expose $34.50, then $33.50.

Silver (XAG/USD) is trading near $36.40 on Wednesday, marking its third consecutive daily decline, as a stronger US Dollar and rising US Treasury yields continue to pressure precious metals. The metal is easing slightly on the day after failing to build on its modest overnight rebound, but remains within a tight consolidation range, just below its recent 13-year highs.
Market sentiment remains cautious as traders weigh the broader impact of fresh tariff threats from US President Donald Trump, which have kept safe-haven demand underpinned but have not been enough to drive a clear breakout in silver prices.
On Tuesday, President Trump unveiled a new wave of aggressive trade measures, expanding the scope of his tariff campaign. Among the key announcements was a 50% tariff on copper imports, aimed at boosting domestic production and reducing reliance on foreign suppliers. Trump also warned of a 200% tariff on pharmaceutical imports, although he granted a 12 to 18-month transition period for companies to shift manufacturing back to the US. In addition, he signaled plans to impose a 10% blanket tariff on all BRICS nations, targeting countries he perceives as aligned against US interests.
This escalation in trade tensions has contributed to global uncertainty, supporting safe-haven assets, such as silver. However, the metal has struggled to gain any meaningful traction, as broader economic factors continue to weigh on sentiment. While geopolitical risks remain elevated, expectations of a delayed interest rate cut by the Federal Reserve (Fed) are limiting silver’s upside potential. Strong US labor market data last week reduced the likelihood of near-term monetary policy easing, keeping the US Dollar supported and capping demand for non-yielding assets.
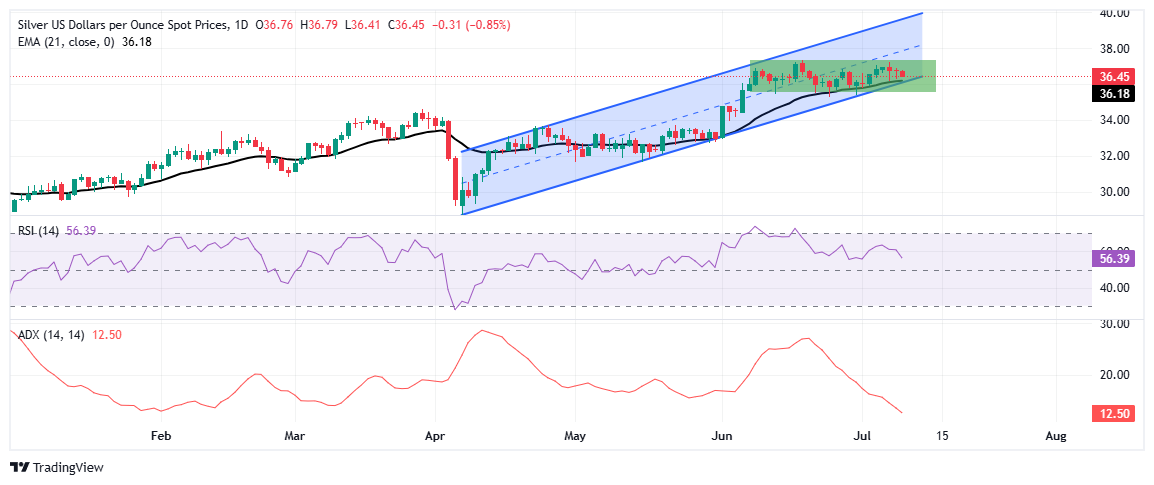
From a technical standpoint, Silver continues to trade within a sideways consolidation range between $35.50 and $37.30, holding inside a broader ascending channel that has guided price action since early April. The metal is now drifting toward the lower boundary of this range, while still holding just above the 21-day Exponential Moving Average (EMA) at $36.19, which has provided dynamic support in recent weeks. A decisive break below this level could expose the $34.50 zone, a former resistance that has now turned into support, with deeper losses potentially opening the path toward $33.50.
Momentum signals remain muted. The Relative Strength Index (RSI) hovers near 56, sloping downwards, reflecting a neutral-to-mildly bullish bias, but with no fresh buying strength. The Average Directional Index (ADX) sits at 12.50, reflecting a weak trend and a lack of directional commitment. A break above the multi-year high of $37.30 remains a key area for confirming a bullish breakout, which could pave the way toward $38.00 and $39.00. Until then, Silver is likely to remain trapped in its range, especially in the absence of major US economic data this week, with traders instead focusing on geopolitical headlines and trade policy developments for fresh direction.
Author

Vishal Chaturvedi
FXStreet
I am a macro-focused research analyst with over four years of experience covering forex and commodities market. I enjoy breaking down complex economic trends and turning them into clear, actionable insights that help traders stay ahead of the curve.


