Silver Price Forecast: XAG/USD jumps to near $34 as Trump’s tariff plan improves safe-haven demand
- Silver price climbs to near $34.00 ahead of Trump’s tariff announcement.
- Trump’s reciprocal tariffs will be unfavorable for the global economy, including the US.
- Investors also await the US ADP Employment Change data for March.

Silver price (XAG/USD) advances to near $34.00 during European trading hours on Wednesday. The white metal moves higher as investors rush to safe-haven assets amid caution ahead of the announcement of reciprocal tariffs by United States (US) President Donald Trump at 20:00 GMT.
US President Trump is poised to announce hefty tariffs on his trading partners in an attempt to fix what he calls unfair trade participants to make “America wealthy again”. According to the Washington Post, the White House aides have drafted a proposal to impose tariffs of around 20% on most imports to the US.
Theoretically, the appeal of the US Dollar (US) should have increased in an uncertain economic environment, but it is struggling to attract bids as Trump’s tariffs will also weigh on the US economic outlook. Additionally, Trump’s tariffs will also boost inflationary pressures in the near term. Such a scenario would allow the Federal Reserve (Fed) to keep interest rates in the current range of 4.25%-4.50% for longer.
Historically, Fed’s restrictive monetary policy stance bodes poorly for non-yielding assets, such as Silver.
In today’s session, investors will also focus on the ADP Employment Change data for March, which will be published at 12:15 GMT. The agency is expected to show that private employers added 105K fresh workers, higher than 77K addition recorded in February.
Silver technical analysis
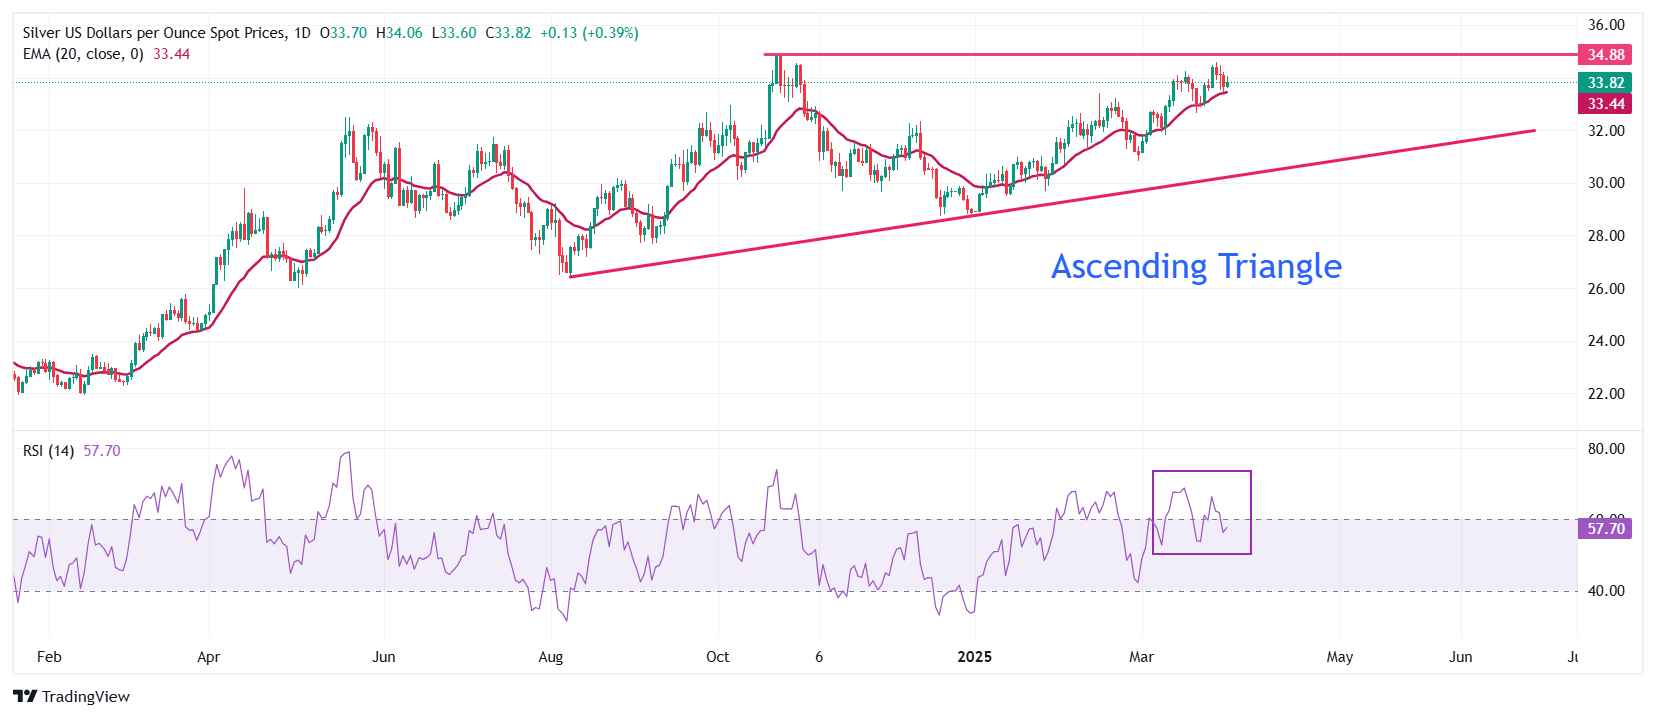
Silver price resumes its upside move towards the flat border of the Ascending Triangle chart pattern formation on the daily timeframe near the October 22 high of $34.87. The upward-sloping border of the above-mentioned chart pattern is placed from the August 8 low of $26.45. Technically, the Ascending Triangle pattern indicates indecisiveness among market participants.
The 20-day Exponential Moving Average (EMA) near $33.44 continues to provide support to the Silver price.
The 14-day Relative Strength Index (RSI) strives to break above 60.00. A bullish momentum would emerge if the RSI holds above 60.00.
Looking down, the March 6 high of $32.77 will act as key support for the Silver price. While, the October 22 high of $34.87 will be the major barrier.
Silver daily chart
Silver FAQs
Silver is a precious metal highly traded among investors. It has been historically used as a store of value and a medium of exchange. Although less popular than Gold, traders may turn to Silver to diversify their investment portfolio, for its intrinsic value or as a potential hedge during high-inflation periods. Investors can buy physical Silver, in coins or in bars, or trade it through vehicles such as Exchange Traded Funds, which track its price on international markets.
Silver prices can move due to a wide range of factors. Geopolitical instability or fears of a deep recession can make Silver price escalate due to its safe-haven status, although to a lesser extent than Gold's. As a yieldless asset, Silver tends to rise with lower interest rates. Its moves also depend on how the US Dollar (USD) behaves as the asset is priced in dollars (XAG/USD). A strong Dollar tends to keep the price of Silver at bay, whereas a weaker Dollar is likely to propel prices up. Other factors such as investment demand, mining supply – Silver is much more abundant than Gold – and recycling rates can also affect prices.
Silver is widely used in industry, particularly in sectors such as electronics or solar energy, as it has one of the highest electric conductivity of all metals – more than Copper and Gold. A surge in demand can increase prices, while a decline tends to lower them. Dynamics in the US, Chinese and Indian economies can also contribute to price swings: for the US and particularly China, their big industrial sectors use Silver in various processes; in India, consumers’ demand for the precious metal for jewellery also plays a key role in setting prices.
Silver prices tend to follow Gold's moves. When Gold prices rise, Silver typically follows suit, as their status as safe-haven assets is similar. The Gold/Silver ratio, which shows the number of ounces of Silver needed to equal the value of one ounce of Gold, may help to determine the relative valuation between both metals. Some investors may consider a high ratio as an indicator that Silver is undervalued, or Gold is overvalued. On the contrary, a low ratio might suggest that Gold is undervalued relative to Silver.
Author

Sagar Dua
FXStreet
Sagar Dua is associated with the financial markets from his college days. Along with pursuing post-graduation in Commerce in 2014, he started his markets training with chart analysis.


