Silver Price Forecast: XAG/USD jumps to near $30.50 on potential US-China trade war
- Silver price climbs to near $30.50 amid fears of potential trade war between the US and China.
- US President Trump threatened to impose additional 50% tariffs on China over reciprocal duties.
- Investors await the US inflation data, which will influence the Fed’s monetary policy outlook.

The price of Silver (XAG) advances to near $30.50 during North American trading hours on Tuesday. The white metal strengthens as its safe-haven appeal has increased, with traders becoming increasingly concerned over the outlook of trade relations between the United States (US) and China.
Earlier in the day, a spokesperson for the Chinese Ministry of Commerce warned that new tariff threats by US President Donald Trump were "a mistake on top of a mistake" and that China would “fight to the end” to protect its interests. The statement from Beijing came after Trump threatened to increase import duties on China to 104% if it imposed 34% tariffs on products imported from the US.
On Thursday, China announced a 34% levy on exports from the US in retaliation to similar reciprocal tariffs slapped by Donald Trump on them on the Liberation Day.
The scenario of a trade war between China and the US would be unfavorable for the global economy. The appeal of Silver increases amid heightening global economic tensions.
However, the demand for Silver as a metal decreases, given its significant application in various industries. China is considered the manufacturing hub of the world, and silver is demanded in various industries, such as Electric Vehicles (EV), electronics, and solar energy.
Going forward, the next major trigger for the Silver price will be the Consumer Price Index (CPI) data for March, which will be released on Thursday. The inflation data will influence market expectations for the Federal Reserve’s (Fed) monetary policy outlook.
Silver technical analysis
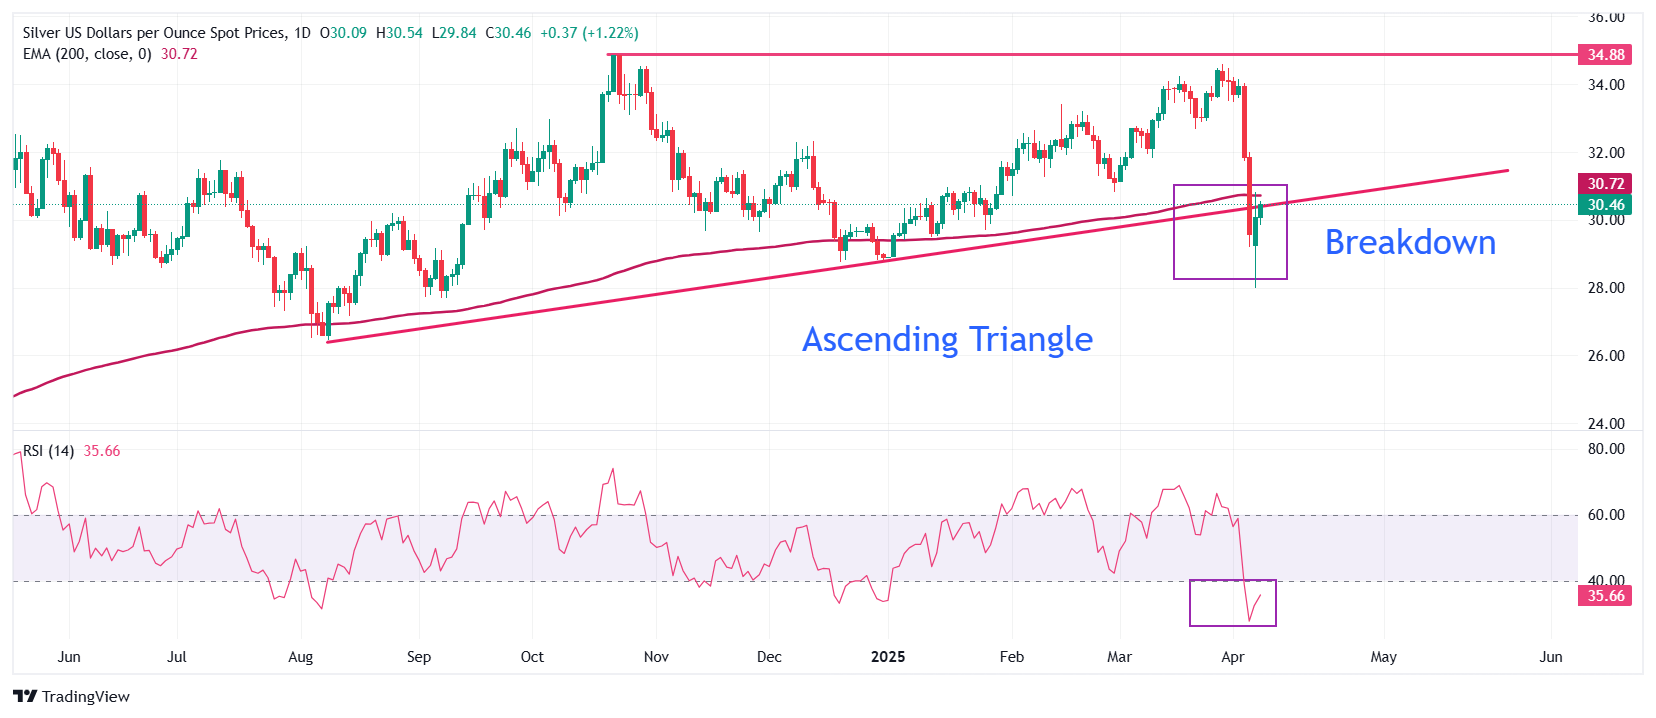
Silver price recovers to test the breakdown region of the Ascending Triangle chart formation near its upward-sloping border around the August 8 low of $26.45. The horizontal resistance of the above-mentioned chart pattern is plotted from the October 22 high of $34.87.
Technically, the breakdown of the Ascending Triangle pattern indicates results in a volatility expansion, which leads to higher volume and formation of wide ticks.
The overall trend of the Silver price is bearish as it trades below the 200-day Exponential Moving Average (EMA), which trades around $30.70.
The 14-day Relative Strength Index (RSI) slides into the 20.00-40.00 range, indicating that a bearish momentum has been triggered.
Looking down, the August 8 low of $26.45 will act as key support for the Silver price. While, the April 4 high of $32.00 will be the major barrier.
Silver daily chart
Silver FAQs
Silver is a precious metal highly traded among investors. It has been historically used as a store of value and a medium of exchange. Although less popular than Gold, traders may turn to Silver to diversify their investment portfolio, for its intrinsic value or as a potential hedge during high-inflation periods. Investors can buy physical Silver, in coins or in bars, or trade it through vehicles such as Exchange Traded Funds, which track its price on international markets.
Silver prices can move due to a wide range of factors. Geopolitical instability or fears of a deep recession can make Silver price escalate due to its safe-haven status, although to a lesser extent than Gold's. As a yieldless asset, Silver tends to rise with lower interest rates. Its moves also depend on how the US Dollar (USD) behaves as the asset is priced in dollars (XAG/USD). A strong Dollar tends to keep the price of Silver at bay, whereas a weaker Dollar is likely to propel prices up. Other factors such as investment demand, mining supply – Silver is much more abundant than Gold – and recycling rates can also affect prices.
Silver is widely used in industry, particularly in sectors such as electronics or solar energy, as it has one of the highest electric conductivity of all metals – more than Copper and Gold. A surge in demand can increase prices, while a decline tends to lower them. Dynamics in the US, Chinese and Indian economies can also contribute to price swings: for the US and particularly China, their big industrial sectors use Silver in various processes; in India, consumers’ demand for the precious metal for jewellery also plays a key role in setting prices.
Silver prices tend to follow Gold's moves. When Gold prices rise, Silver typically follows suit, as their status as safe-haven assets is similar. The Gold/Silver ratio, which shows the number of ounces of Silver needed to equal the value of one ounce of Gold, may help to determine the relative valuation between both metals. Some investors may consider a high ratio as an indicator that Silver is undervalued, or Gold is overvalued. On the contrary, a low ratio might suggest that Gold is undervalued relative to Silver.
Author

Sagar Dua
FXStreet
Sagar Dua is associated with the financial markets from his college days. Along with pursuing post-graduation in Commerce in 2014, he started his markets training with chart analysis.


