Silver Price Forecast: XAG/USD flirts with weekly low, just above $33.00 mark
- Silver remains under some selling pressure for the third successive day on Friday.
- Acceptance below the 23.6% Sibo. level supports prospects for additional losses.
- The mixed technical setup warrants some caution for aggressive bearish traders.

Silver (XAG/USD) attracts some sellers for the third successive day on Friday and slides to the $33.00 neighborhood during the Asian session, back closer to a one-week low touched the previous day.
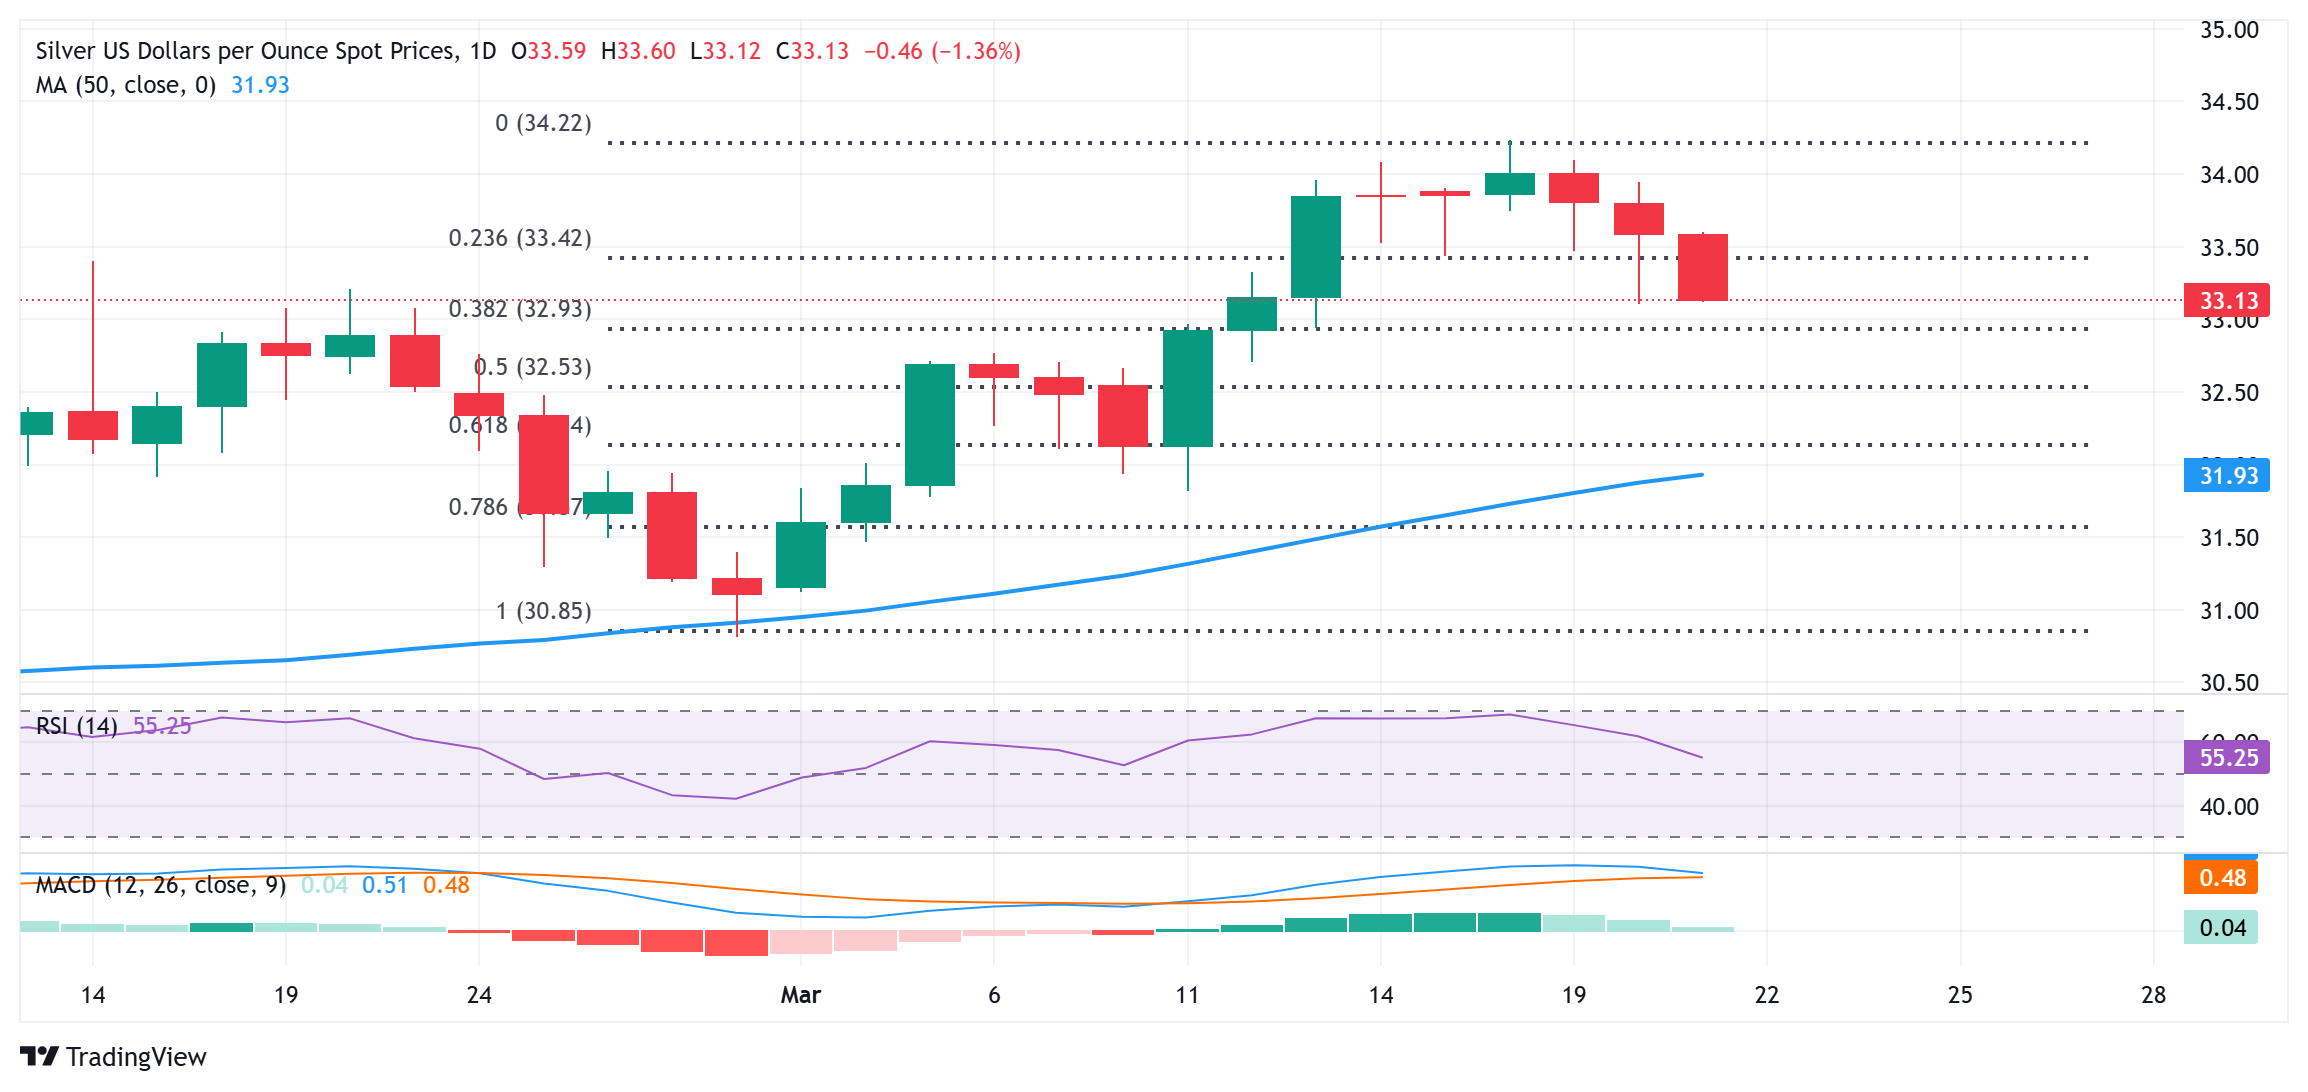
From a technical perspective, the XAG/USD now seems to have found acceptance below the 23.6% Fibonacci retracement level of the recent upswing from the late February low, around the $30.80 region. This supports prospects for deeper losses. However, oscillators on the daily chart – though they have been losing traction – are still holding in positive territory. Hence, any further decline is more likely to find decent support near the 38.2% Fibo. level, around the $32.95-$32.90 zone.
Bearish traders might wait for a sustained break below the said area before positioning for an extension of the retracement slide from the $34.20-$34.25 region, or the highest level since October touched on Tuesday. The XAG/USD might then accelerate the fall towards the 50% Fibo. level, around the $32.55-$32.50 zone, before eventually dropping to the $32.00 mark or the 61.8% Fibo. level. A convincing break below the latter will suggest that the white metal has topped out in the near term.
On the flip side, the 23.6% Fibo. level, around the $33.40 region, could act as an immediate hurdle. Some follow-through buying beyond the Asian session high, around the $33.55 area, has the potential to lift the XAG/USD towards the $34.00 mark en route to a multi-month peak, around the $34.20-$34.25 zone. This is followed by barriers near the $34.55 area and the $34.85 region, or a multi-year peak touched in October, which if cleared will be seen as a fresh trigger for bullish traders.
Silver daily chart
Silver FAQs
Silver is a precious metal highly traded among investors. It has been historically used as a store of value and a medium of exchange. Although less popular than Gold, traders may turn to Silver to diversify their investment portfolio, for its intrinsic value or as a potential hedge during high-inflation periods. Investors can buy physical Silver, in coins or in bars, or trade it through vehicles such as Exchange Traded Funds, which track its price on international markets.
Silver prices can move due to a wide range of factors. Geopolitical instability or fears of a deep recession can make Silver price escalate due to its safe-haven status, although to a lesser extent than Gold's. As a yieldless asset, Silver tends to rise with lower interest rates. Its moves also depend on how the US Dollar (USD) behaves as the asset is priced in dollars (XAG/USD). A strong Dollar tends to keep the price of Silver at bay, whereas a weaker Dollar is likely to propel prices up. Other factors such as investment demand, mining supply – Silver is much more abundant than Gold – and recycling rates can also affect prices.
Silver is widely used in industry, particularly in sectors such as electronics or solar energy, as it has one of the highest electric conductivity of all metals – more than Copper and Gold. A surge in demand can increase prices, while a decline tends to lower them. Dynamics in the US, Chinese and Indian economies can also contribute to price swings: for the US and particularly China, their big industrial sectors use Silver in various processes; in India, consumers’ demand for the precious metal for jewellery also plays a key role in setting prices.
Silver prices tend to follow Gold's moves. When Gold prices rise, Silver typically follows suit, as their status as safe-haven assets is similar. The Gold/Silver ratio, which shows the number of ounces of Silver needed to equal the value of one ounce of Gold, may help to determine the relative valuation between both metals. Some investors may consider a high ratio as an indicator that Silver is undervalued, or Gold is overvalued. On the contrary, a low ratio might suggest that Gold is undervalued relative to Silver.
Author

Haresh Menghani
FXStreet
Haresh Menghani is a detail-oriented professional with 10+ years of extensive experience in analysing the global financial markets.


