Silver Price Forecast: XAG/USD flat lines around $36.75 area; bullish potential seems intact
- Silver stalls the overnight pullback from a multi-year peak, though it lacks a firm intraday direction.
- The bullish technical setup suggests that the path of the least hurdle for the XAG/USD is to the upside.
- A convincing break and acceptance below the $36.00 mark is needed to negate the positive outlook.

Silver (XAG/USD) oscillates in a narrow range around the $36.75 area during the Asian session on Thursday and for now, seems to have stalled the previous day's modest pullback from its highest level since February 2012. Meanwhile, the technical setup favors bullish traders and suggests that the path of least resistance for the white metal is to the upside.
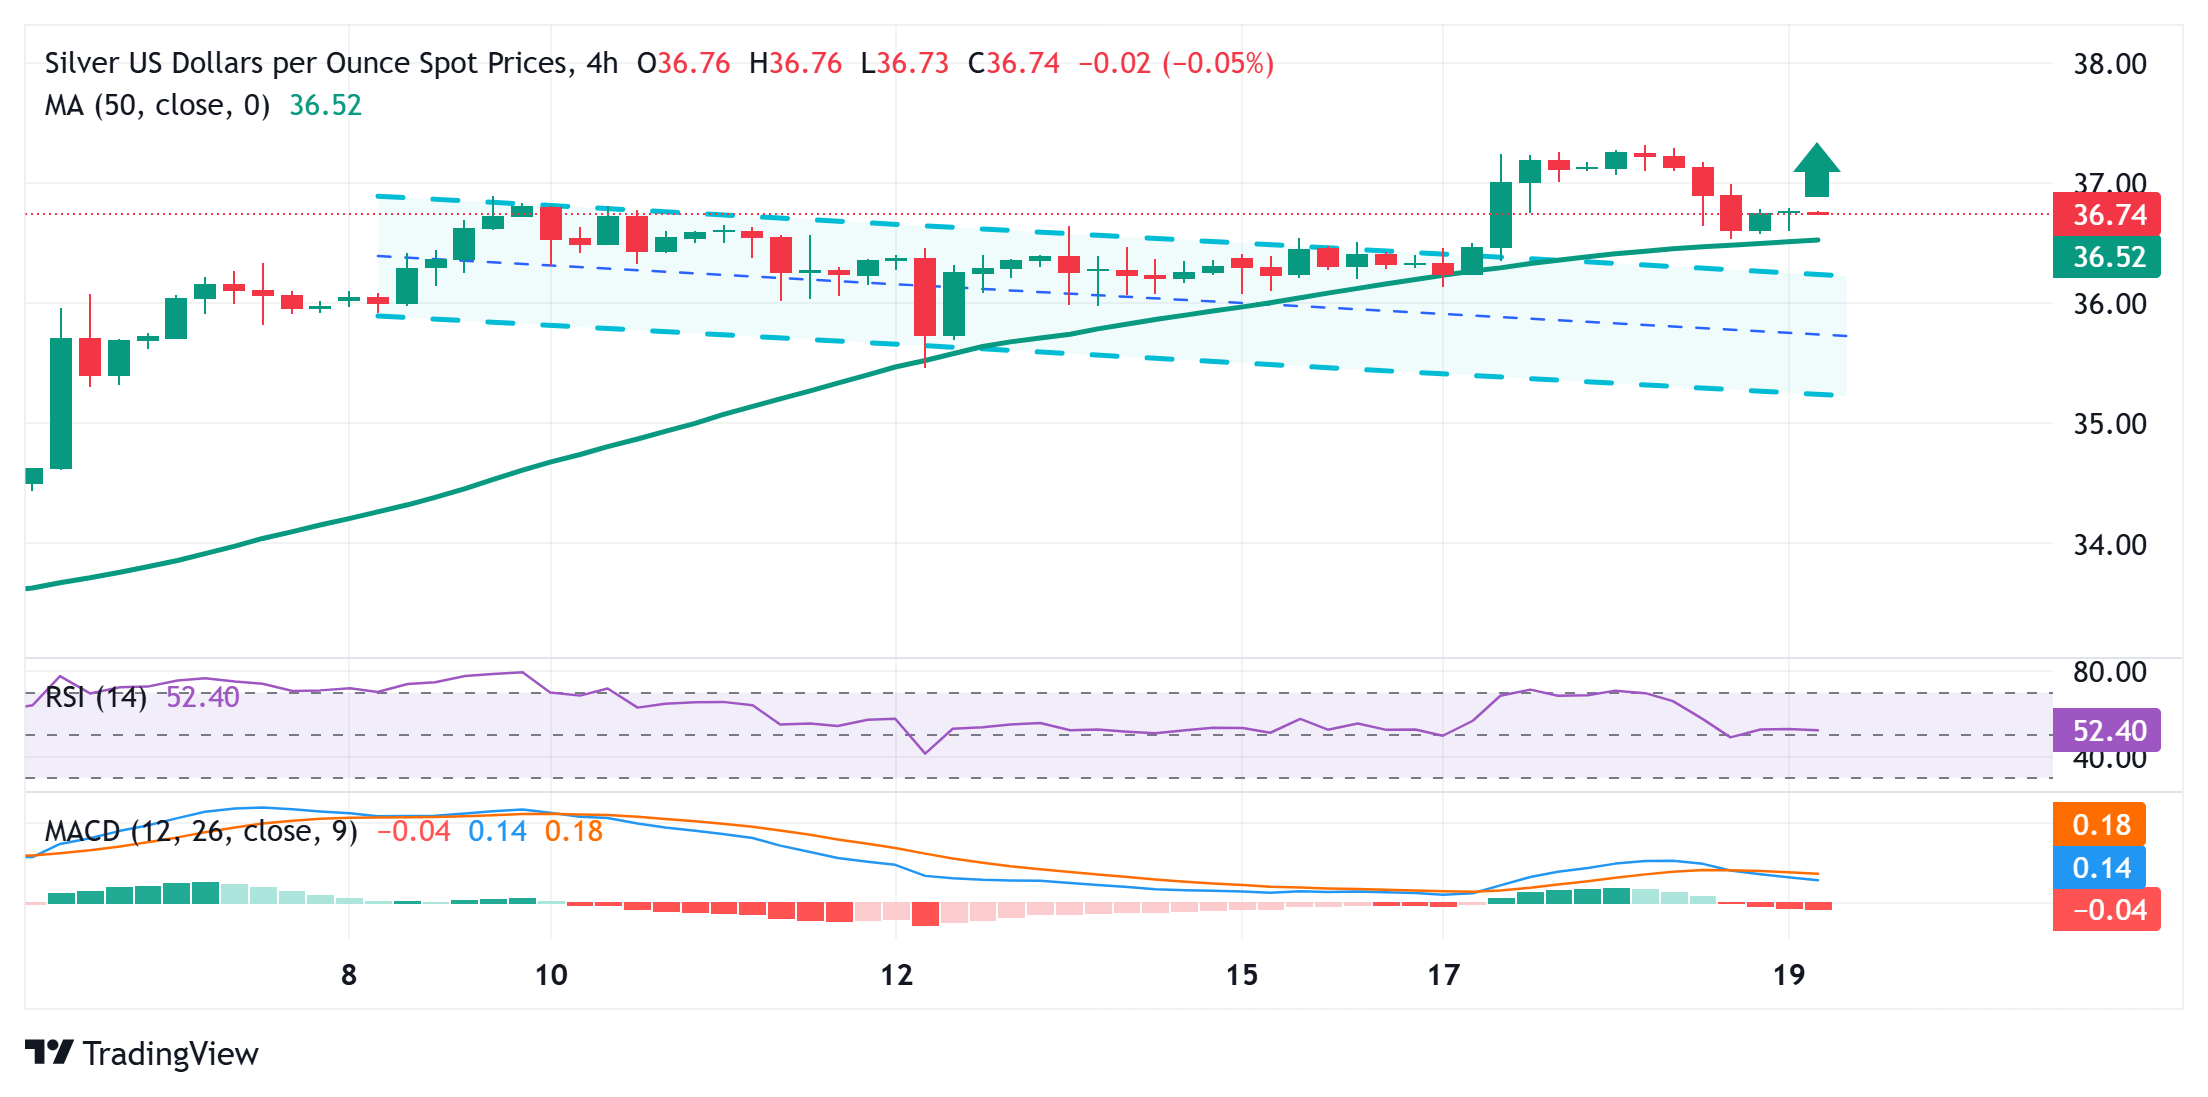
A sustained strength beyond the $36.45-$36.50 barrier confirmed a breakout through a short-term descending trend channel, which constituted the formation of a bullish flag pattern. Moreover, the Relative Strength Index (RSI) on the daily chart has also eased from overbought territory. This, along with positive oscillators, validates the near-term constructive outlook for the XAG/USD.
Hence, a subsequent move beyond the $37.00 round figure, towards retesting the multi-year high around the $37.30-$37.35 area touched on Wednesday, looks like a distinct possibility. Some follow-through buying beyond the mid-$37.00s, or the February 2012 high, should allow the XAG/USD to reclaim the $38.00 mark and climb toward the next relevant hurdle near the $38.50-$38.55 region.
On the flip side, the 50-period Simple Moving Average (SMA) on the 4-hour chart, near the $36.55 area, could lend some support ahead of the trend-channel breakpoint, currently around the $36.30 region. This is followed by the weekly low, around the $36.15 region, and the round figure. The latter should act as a key pivotal point, which if broken might shift the near-term bias in favor of bears.
Silver 4-hour chart
Silver FAQs
Silver is a precious metal highly traded among investors. It has been historically used as a store of value and a medium of exchange. Although less popular than Gold, traders may turn to Silver to diversify their investment portfolio, for its intrinsic value or as a potential hedge during high-inflation periods. Investors can buy physical Silver, in coins or in bars, or trade it through vehicles such as Exchange Traded Funds, which track its price on international markets.
Silver prices can move due to a wide range of factors. Geopolitical instability or fears of a deep recession can make Silver price escalate due to its safe-haven status, although to a lesser extent than Gold's. As a yieldless asset, Silver tends to rise with lower interest rates. Its moves also depend on how the US Dollar (USD) behaves as the asset is priced in dollars (XAG/USD). A strong Dollar tends to keep the price of Silver at bay, whereas a weaker Dollar is likely to propel prices up. Other factors such as investment demand, mining supply – Silver is much more abundant than Gold – and recycling rates can also affect prices.
Silver is widely used in industry, particularly in sectors such as electronics or solar energy, as it has one of the highest electric conductivity of all metals – more than Copper and Gold. A surge in demand can increase prices, while a decline tends to lower them. Dynamics in the US, Chinese and Indian economies can also contribute to price swings: for the US and particularly China, their big industrial sectors use Silver in various processes; in India, consumers’ demand for the precious metal for jewellery also plays a key role in setting prices.
Silver prices tend to follow Gold's moves. When Gold prices rise, Silver typically follows suit, as their status as safe-haven assets is similar. The Gold/Silver ratio, which shows the number of ounces of Silver needed to equal the value of one ounce of Gold, may help to determine the relative valuation between both metals. Some investors may consider a high ratio as an indicator that Silver is undervalued, or Gold is overvalued. On the contrary, a low ratio might suggest that Gold is undervalued relative to Silver.
Author

Haresh Menghani
FXStreet
Haresh Menghani is a detail-oriented professional with 10+ years of extensive experience in analysing the global financial markets.


